The DNA studies featured on this page and the following ones are based on so-called autosomal DNA. In theory this will allow for a genome-wide analysis (covering all chromosomes). Which will by definition be much more comprehensive than haplogroup studies. Usually autosomal studies will be applying so-called admixture analysis. While more recent studies (post 2020) are also often investigating shared IBD segments (Identical By Descent) to make ancestral inferences. Several insightful studies making use of autosomal DNA have already been performed for Cape Verdeans. On this page I will discuss the following ones:
- The Admixture Structure and Genetic Variation of the Archipelago of Cape Verde and Its Implications for Admixture Mapping Studies (Beleza et al., 2012)
- Genetic Architecture of Skin and Eye Color in an African-European Admixed Population (Beleza et al., 2013)
- Parallel Trajectories of Genetic and Linguistic Admixture in a Genetically Admixed Creole Population (Verdu et al., 2017)
For a combined review and also comparison with my own surveyfindings see:
- 100 Cape Verdean AncestryDNA results (Fonte Felipe, 2018) (sections 2, 3 and 6)
***
The Admixture Structure and Genetic Variation of the Archipelago of Cape Verde and Its Implications for Admixture Mapping Studies (2012)
Figure 1 (click to enlarge)
***
Figure 2 (click to enlarge)
***
____________________
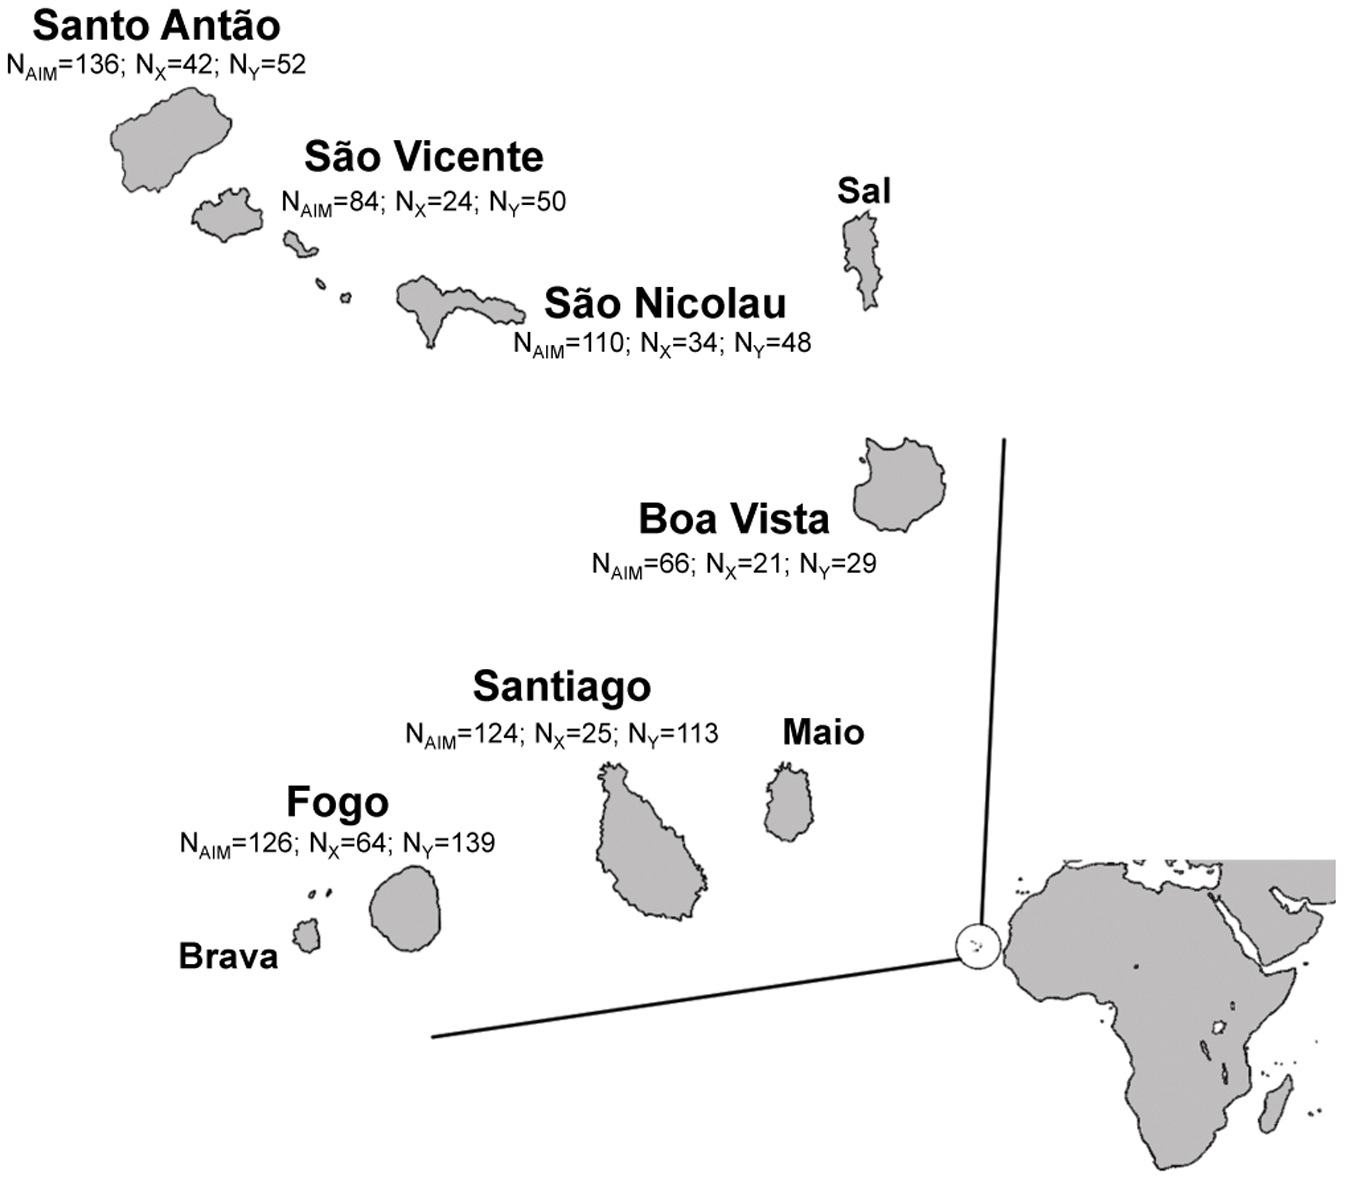
“The African ancestry proportions estimated with different panels of markers also revealed substantial variation in admixture among the sampled islands, with Santiago showing significantly higher levels of African ancestry than the other islands. This variation is generally consistent with the settlement history of the archipelago, since Santiago was the first island to be peopled and its economy was initially based on a plantation system that largely depended on African slaves. In turn, the islands of Santo Antão, São Vicente, São Nicolau and Boavista, which show significantly lower African admixture levels than Santiago, were mostly populated by admixed free peasants that migrated northwards after the decline of the slave-based economy.” (Beleza et al., 2012).
____________________
This is the first largescale study into Cape Verdean genetics performing autosomal analysis. Based on a massive and sofar unrivalled research effort to collect samples across most of the islands. Very commendable (see this news article from 2010)! Of course there are some inherent limitations. The autosomal admixture results are actually quite rudimentary. Only making a continental distinction, without any further regional specification. And in fact this study for the most part still heavily relies on haplogroup analysis (mostly Y-DNA). Then again the outcomes are very useful and highly relevant! I also find that the historical contextualization for the most part is quite well-informed.1 Which regrettably is not always the case for other DNA studies.
The most intriguing part of this study describes how genetic differentiation might be related to historical settlement patterns for each island. In particular when making a distinction between the northern (Barlavento) and southern (Sotavento) islands. Based also on the analysis of Y-DNA. This provides an insightful elaboration of what was first discussed in the Brehm et al. study (2002) (based on mt-DNA). Going by my own understanding of Cape Verde’s historical demography this outcome indeed makes sense.
Because of genetic drift and smaller founding populations in the Barlavento (Santo Antão & São Nicolau) and a bigger impact of continued lowlevel slave imports during the 1700’s/1800’s in Sotavento (Fogo & Santiago) it may be assumed that the diversity of African origins in Barlavento is largely a subset of the greater diversity found in Sotavento. On the other hand it may also be that some lineages/ancestries could be unique to either Barlavento or Sotavento because they were introduced by atypical North European slavetrading in the 1700’s. I have seen some historical references being made to English/French ships selling slaves in Cape Verde (illegally) from Senegambia, but also further away (Benin and even Congo). The numbers involved must have been small though because Cape Verdean slaveowning elites were very much impoverished at that time and production in the slavelabour sectors was decreasing if anything.
____________________
“Taking into consideration the historical data, these patterns could be interpreted in two ways. According to one hypothesis, a substantial part of the North-to-South genetic differentiation can be attributed to demographic events (admixture, drift and founder effects) ensuing the initial settlement of Santiago and Fogo, without further significant exogenous contributions besides the regular importation of slaves to the two southern islands. Alternatively, the North and South genetic clusters could result from separate migrations coming from Europe (mainly Portugal) and the West Coast of Africa, which then evolved in parallel before converging into a common cultural and social background.
Consistent with the first hypothesis, we found that Santiago is the most genetically diverse island of the archipelago (Figure 5), and played particularly important role in the settling of Fogo (Table 3), where evidence for founder effects is especially striking (Figure 5). However, the two peopling hypotheses are not mutually exclusive and we also find a significant genetic component that is exclusive to each island.
All these results, together with the admixture analysis, are concordant in indicating that the most likely scenario for the colonization of the Cape Verde archipelago may lie in between the two stated hypotheses, suggesting that the various groups of islands have a shared genetic history that results from a common origin in Santiago, followed by differentiation through genetic drift and subsequent input of independent external migrations.“
____________________
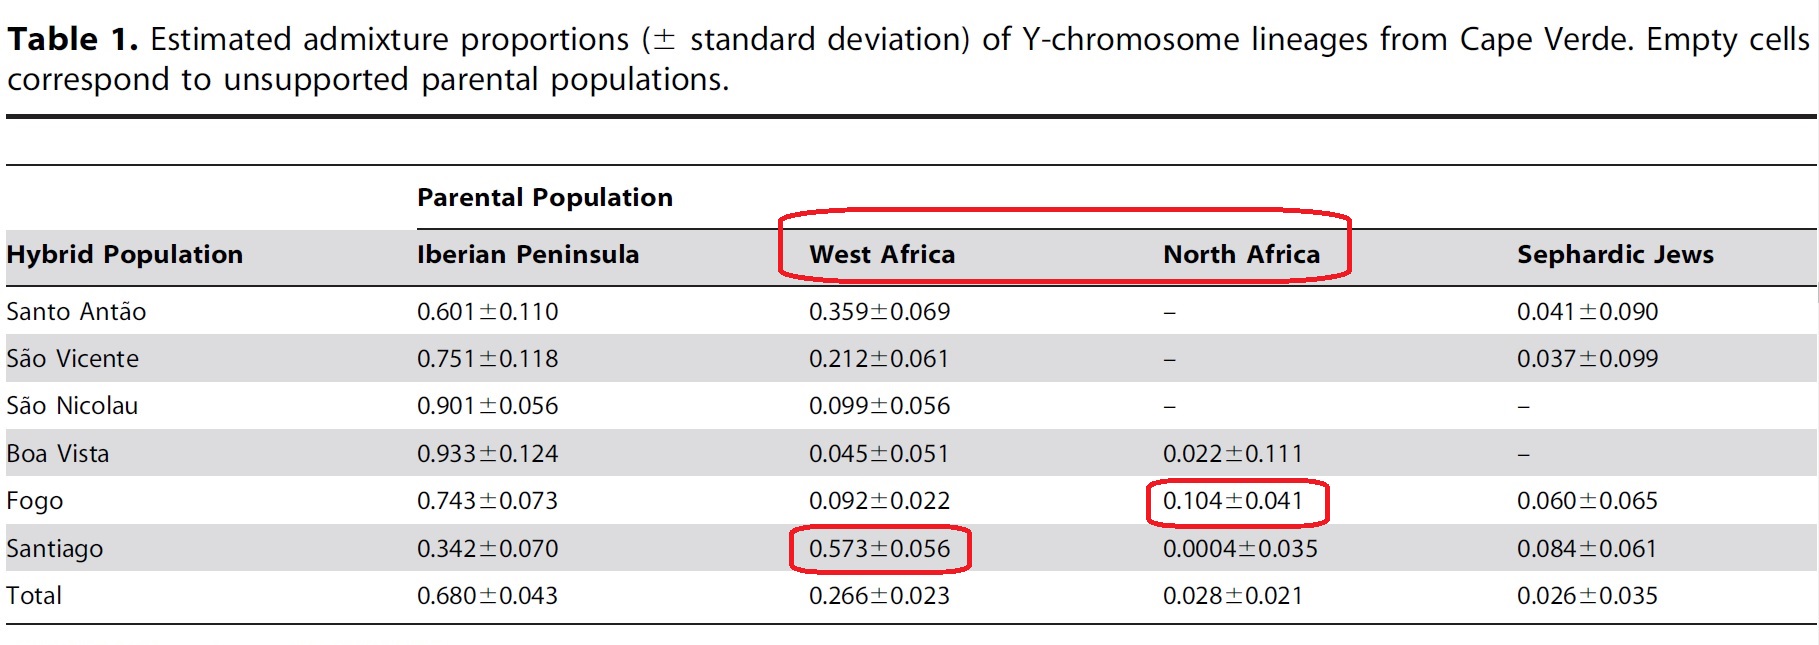
Another very fascinating outcome of this study concerns the possible degree of North African lineage among Cape Verdeans. As measured by North African related Y-DNA. However one should be very careful with this topic. Because “North African” DNA is an ambiguous category which might actually also be derived from Portuguese ancestors! Aside from signalling actual North African ancestry (Berber, Guanche etc.). And then there is a further complication that Fula populations from Upper Guinea also have a minor but substantial genetic component which is often being read as “North African”. The Sephardic findings (peaking in Santiago!) are also very interesting but outside of scope given this website’s focus on specifying African origins. For more discussion see:
- “Africa North”, “Middle East”, “European Jewish” and other minor regional scores (scroll down to secton 6)
Table 1 (click to enlarge)
***
____________________
“To formally assess the paternal contribution of different populations, we performed an admixture analysis, using the approach implemented in Admix 2.0 [37] and treating the Cape Verdean population as a result of admixture of four parental populations: Iberian Peninsula, West Africa, North Africa and the Sephardic Jewish population (Table 1). This 4-way admixture analysis was prompted by previous suggestions, based on genetic and historical data, that enslaved North Africans and Iberian Jews represented non-negligible fractions of African and European parental groups, respectively.
According to the admixture analysis, the majority of male contributions to Cape Verde were derived from the Iberian Peninsula (0.68). The second most important contribution (0.27) came from West Africa, while contributions from Northern Africa and Sephardic Jews seem to have been residual (∼0.03 each, with wide confidence intervals).” (Beleza et al., 2012, p.5).
____________________
Genetic Architecture of Skin and Eye Color in an African-European Admixed Population (2013)
Figure 3 (click to enlarge)
____________________
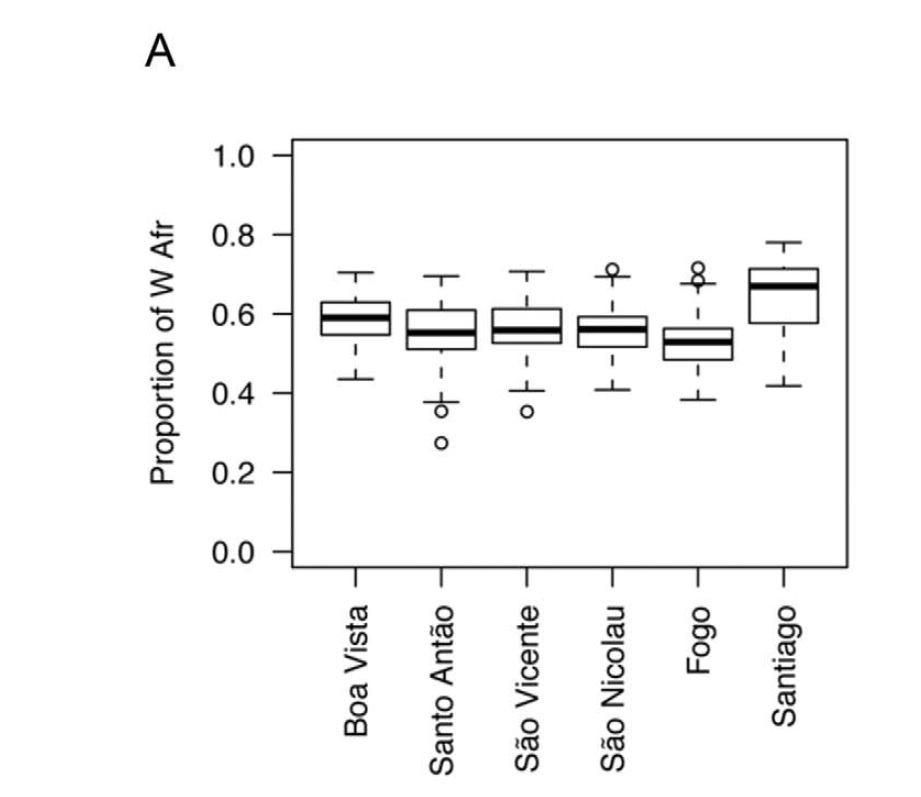
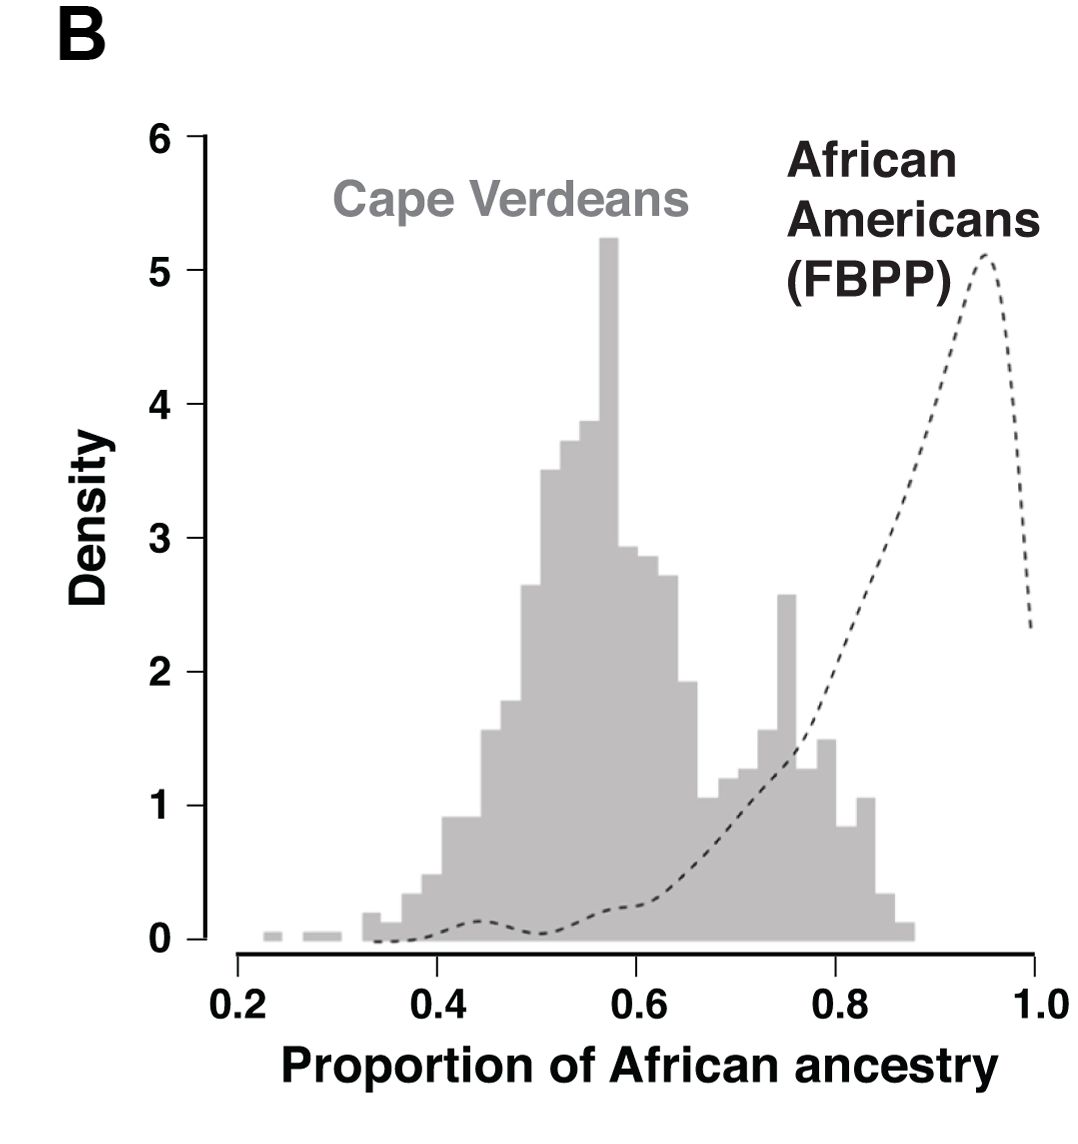
“Overall, African genomic ancestry in Cape Verdeans ranges from 23.5% to 87.9%, with a median of 58%. Across different islands, the distributions of African genomic ancestry exhibit substantial overlap in range but vary in their median values, from 50.5% in Fogo to 74.4% in the capital island of Santiago (Figure 1a), which suggests a population history of extensive intercontinental admixture accompanied by reduced gene flow between islands.” (Beleza et al., 2013).
____________________
This second study is actually a continuation by the research team of the previous study (Beleza et al.). The database of Cape Verdean samples (n=685) is practically the same. Although already quite extensive it should be noted that sampling from Brava, Maio and Sal is missing. I do also suspect that the Santiago sampling was biased towards the capital Praia. Sampling among the more interior and rural parts of Santiago would likely have resulted in more elevated African admixture levels. But this is speculation on my part! Continued discussion further below.
The admixture analysis is again very basic. But the observed admixture range has been replicated also in more recent studies as well as my own survey findings. Including also the main tendencies for each island. Otherwise this study provides highly fascinating outcomes and discussion regarding the interplay between genetics & phenotype among Cape Verdeans. However I will not discuss this in further detail because this topic is out of scope for the purposes of this website. See overview below for their main research outcomes:
- Major loci for skin and eye color (Cape Verdean frequencies are shown on the far right side)
***
Parallel Trajectories of Genetic and Linguistic Admixture in a Genetically Admixed Creole Population (2017)
Figure 4 (click to enlarge)
____________________
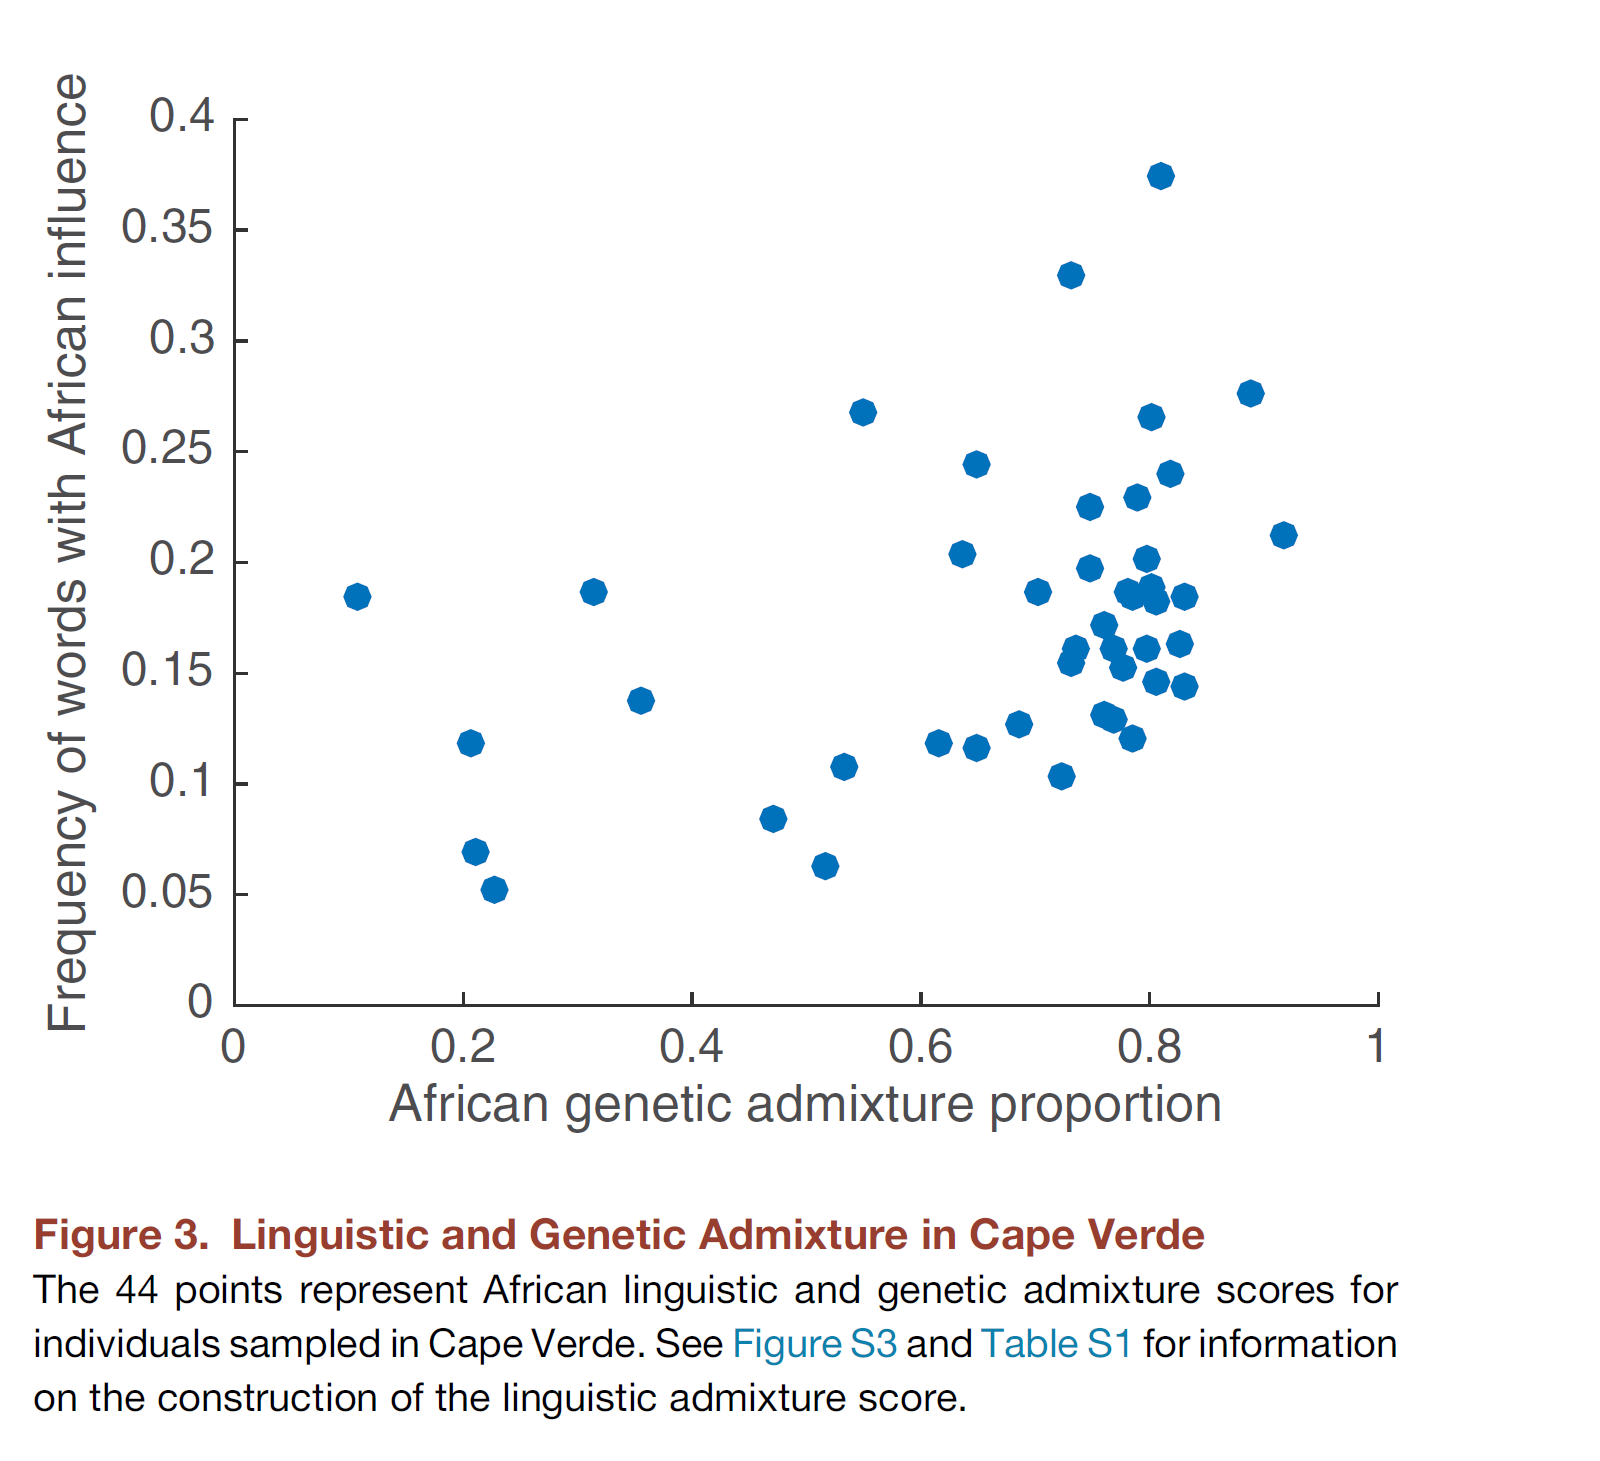
“the results suggest that Cape Verdean genetic and linguistic admixture have followed parallel evolutionary trajectories, with cotransmission of genetic and linguistic variation” (Verdu et al, 2017, p.2529)
“We sampled 50 Kriolu-speaking adult volunteers living on the island of Santiago (Figure S1), 40 in the capital city, Praia, and 10 in the inland town of Picos. We recorded birthplaces of individuals and their parents and grandparents. Birthplaces and parental birthplaces included seven of the nine main inhabited islands of Cape Verde as well as other formerly Portuguese-controlled locations (Angola, Brazil, Guinea-Bissau, Mozambique, Portugal, and São Tomé). The majority of both offspring (38/50) and parents (71/100) were born on Santiago.” (Verdu et al, 2017, p.2536).
____________________
This is a highly fascinating study which combines genetics with linguistics arguing that they are possibly correlated regarding their African aspects. For a more detailed discussion of the main linguistic findings see the Crioulo Language section. As mentioned in the quote above this study is based on samples taken from Santiago but not per se with 4 grandparents born in Santiago. Most of them (40/50) are also from the national capital of Praia. For future research efforts it would be preferable to focus on samples from the deep interior of Santiago.3
Then again despite being smaller in size their dataset does seem in line with Santiago’s admixture range as detected by Beleza et al. (2012 & 2013, see figure 2). Regrettably no specific admixture statistics are given in this study. But based on Figure 4 it seems an African admixture range of around 80% would have been most frequent. With a maximum value of possibly just over 90% African. Interestingly this person’s African linguistic score seems to have been rather low though (around 0.2, see figure 4, the dot on the far right). Indicating that the genetic/linguistic correlation which was found by the study (0.45) is variable, and also dependent on individual aspects.
Figure 5 (click to enlarge)
____________________
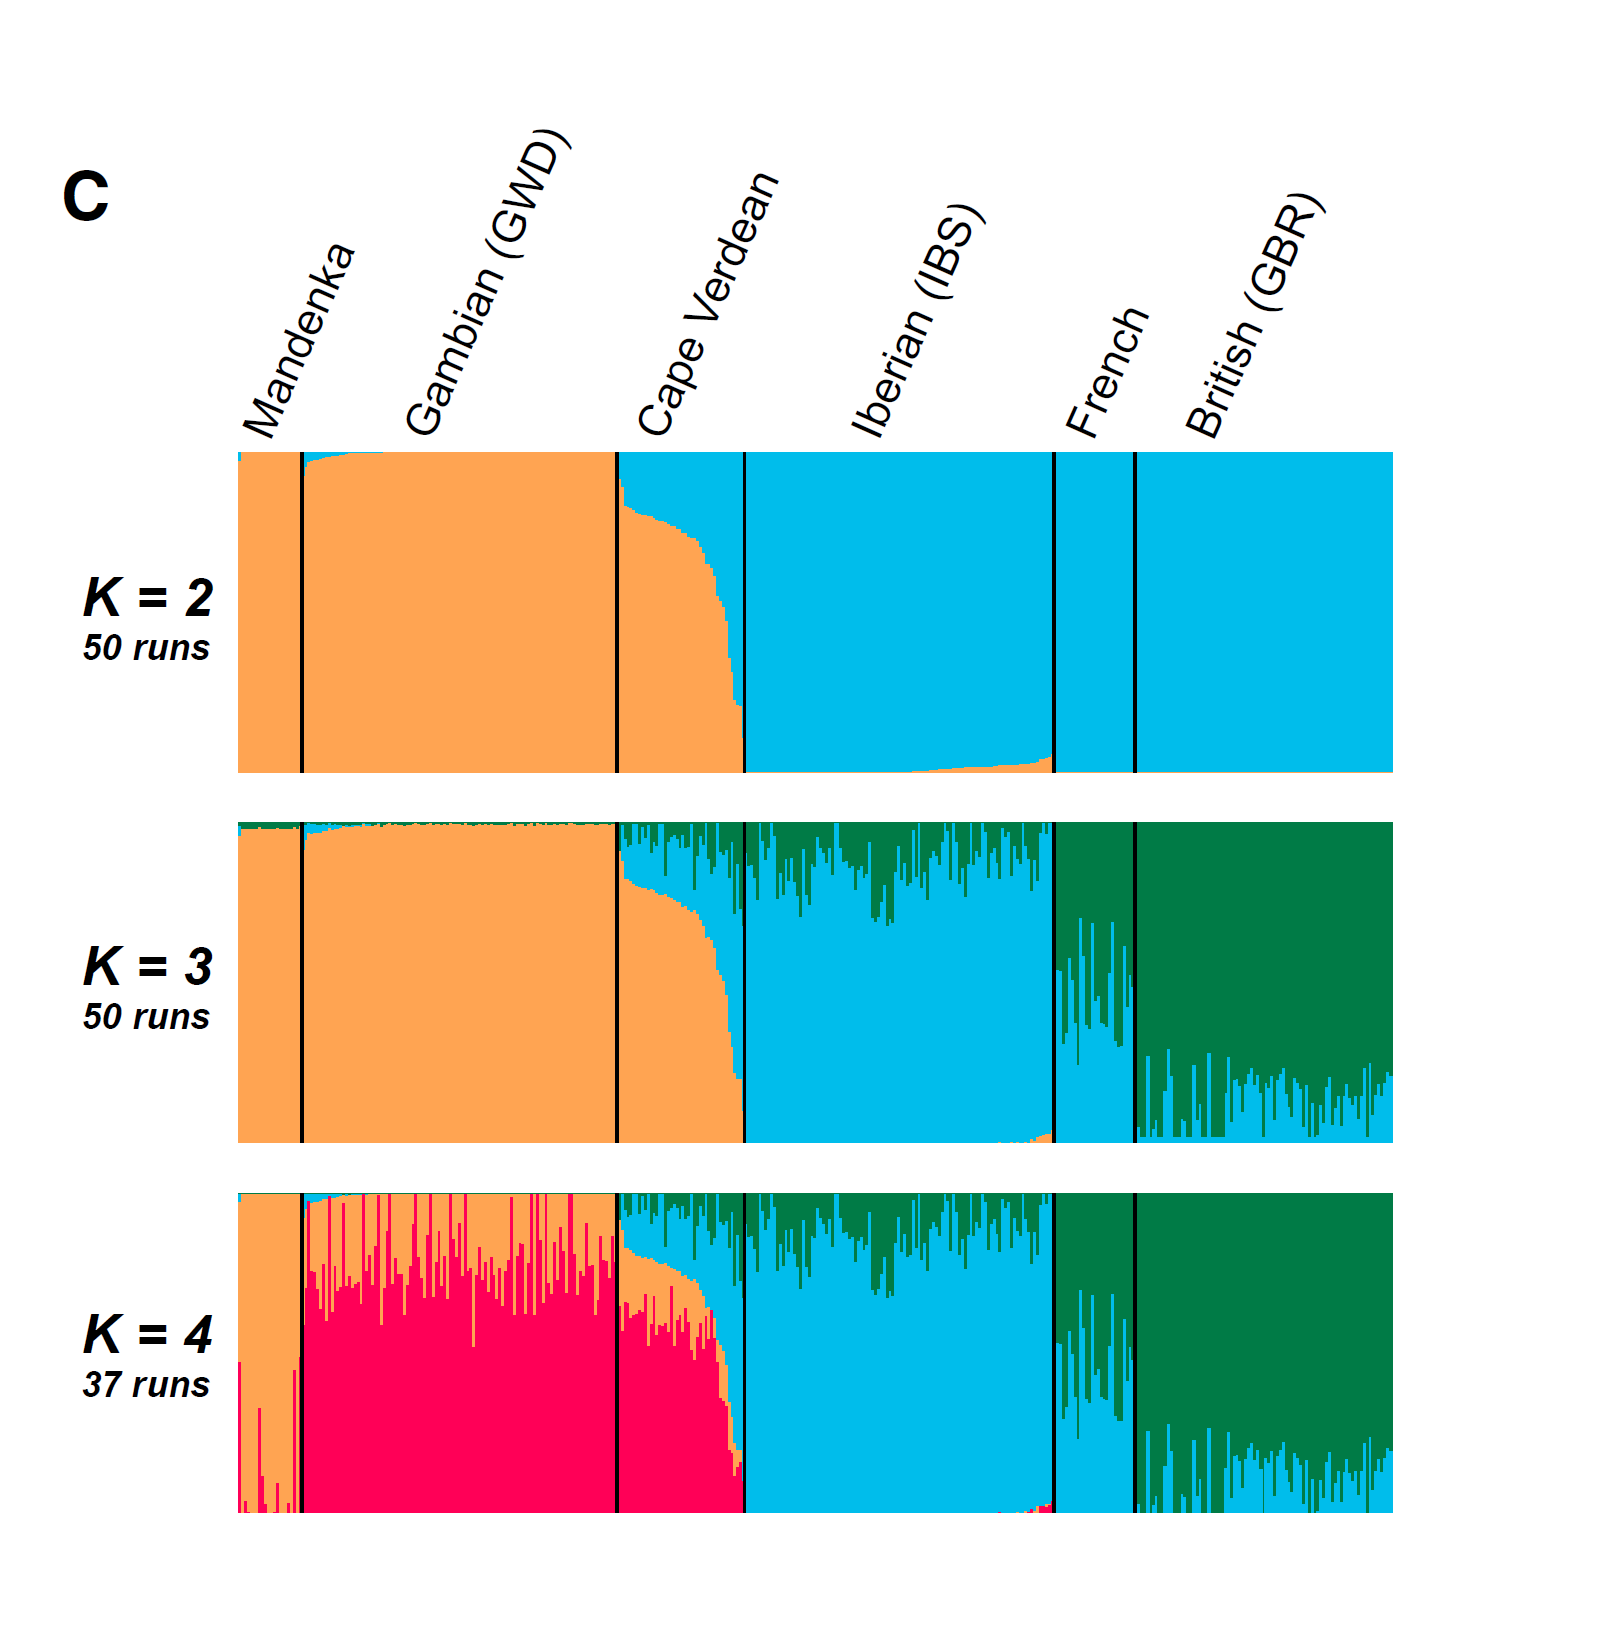
“Plots with K = 2 and K = 3 clusters [figure5] suggest that the Cape Verdean sample derives from genetic admixture between African and European populations for which Senegambians and Iberians are close proxies. ADMIXTURE at K = 4 finds a new cluster that corresponds primarily to Gambian Mandinka individuals and that is distinct from the cluster seen in the Senegalese Mandenka. The clustering component of Cape Verdean individuals at K = 4 that reflects similarity to West Africans more closely resembles the patterns exhibited by the Gambian Mandinka.” (Verdu et al., p.2530, 2017)
____________________
In Figure 5 a very useful research outcome is displayed.4 It shows a socalled ADMIXTURE run comparing 44 Cape Verdean samples with 109 Gambian Mandinka samples and 22 Senegalese Mandenka samples as well as European samples from Iberia (Spain), France and Great Britain. At K=4 four different putative ancestral clusters are being revealed. And it turns out that the selected Gambian samples (red) are a better match than the Senegalese samples (orange) to capture Cape Verde’s Upper Guinean ancestry.
Naturally Cape Verde’s actual African origins include many more ethnic groups than just these two very closely interrelated Mandé subgroups. This outcome is firstmost the consequence of a restricted African reference panel as well as other inherent limitations of the ADMIXTURE software. Intuitively this outcome does make sense though because of Gambia being geographically closer to Guiné Bissau. This latter country arguably being the best proxy for Cape Verde’s overall Upper Guinean heritage, even if not exclusively so. Although I suppose it might also be that simply because of the greater number of Gambian samples the odds of genetic similarity were also increased.
The output of this type of admixture analysis is naturally predetermined to a great degree by the input. Actually a comparison with Mende samples from Sierra Leone (again a Mandé speaking subgroup) is also being made in the study (fig. 1A). And according to the authors “The Gambian Mandinka and Senegalese Mandenka are genetically closer to Cape Verdeans than are the Sierra Leone Mende” ((Verdu et al., p.2430). Which again seems right although I suspect that for historical reasons the Temne from northern Sierra Leone might have made a better fitting proxy than the Mende from southern Sierra Leone. See also:
- Maps of various Mandé speaking groups (scroll down for it) (Tracing African Roots)
- Top 20 Ethnic African Roots for Cape Verdeans (Cabo Verde Raizes Na Africa)
This research outcome from Verdu et al. clearly demonstrates the added value of expanding Upper Guinean reference populations in DNA testing. Beyond the limited and overused (also by personal DNA testing companies) Senegalese Mandenka samples. On my Tracing African Roots blog I have been advocating for this since 2015 already (see this blogpost). But actually even earlier I tried to convince 23andme to make use of the very well-suited Senegambian samples collected by Jallow et al., 2009. I therefore fully concur with the suggestion being made in Verdu et al. that especially the inclusion of Wolof samples might benefit an even more adequate genetic analysis of Cape Verde’s Upper Guinean heritage.
___________________________________________________________________________
Notes
1) In Beleza et al. (2012) a fascinating and very useful account is given about the settlement patterns of the various Cape Verdean islands. Even though it is well-referenced I do find that in some aspects the hypotheses being proposed by the authors are too rigidly trying to fit their genetic research data into one single model. In particular their theory on why Santiago should have a higher African admixture level than Fogo:
____________________
“Fogo island displays low African ancestry levels that are similar to the northern islands, even though its settlement history is concurrent with Santiago and based on the same slave labor system [17]. It is likely that this discrepancy resulted from differential survival and integration levels of ‘‘rural slave’’ communities after slavery was abolished. According to this interpretation, the emergent societies of the islands of Fogo and Santiago would have been divided into two major subgroups with very different reproductive success: one composed by the offspring of mixed unions between European men and ‘‘domestic’’ slave women, which later became the major ruling segment of the Cape Verde society; and the other composed by the ‘‘rural slaves’’ who, due to their higher mortalities (both pre- and post-reproductive,) had to be continuously replaced by other enslaved Africans from the mainland.
Historical work has shown that the slave labor system was more extreme and lasted longer in Fogo than in Santiago [14]. In addition, it is likely that the relative proportions of ‘‘rural slaves’’ and admixed rulers were higher in Santiago than in Fogo, because of the larger size of the former. In this setting, the higher levels of African ancestry presently observed in Santiago were likely to be caused by demographic and social conditions favoring the attenuation of cultural mediated forms of differential reproductive success [54,55] between admixed rulers and former slaves.” (Beleza et al., 2012, p.10).
____________________
I agree that these factors could indeed partially explain the difference in African admixture levels between Fogo & Santiago. But I am still missing the role of Badiu or runaway slave a.k.a. maroon communities in Santiago. Most likely already arising in the 1500’s and later on in time also replenished by manumitted ex-slaves. Due to favourable geography and its greater interior I would assume that Santiago was more suitable to host such communities when compared with Fogo. And this could then account for a greater retention of African genetics (as well as culture) within Santiago as well.
In the quote above it is also mentioned that due to high mortality rural slaves had to be “continuously replaced by other enslaved Africans from the mainland“. I am however under the impression that Cape Verde’s enslaved population was heavily creolized (locally born) already in the 1600’s (see this blog post). While going by the census taken in 1856 only 1% of Cape Verde’s population might then have been born in mainland Africa (see this blog post). So this seems to be a misjudgement on part of the authors of Beleza et al. (2012).
Also inspite of the persistence of slavery its overall impact on Cape Verde’s population composition must have been quite limited going by the census taken in 1731. Even for Fogo and Santiago where relatively speaking the slavery system endured the longest. For Santiago the share of enslaved persons within the entire island population being less than 20% and for Fogo around 25% in 1731. While already in 1731 Fogo was having a noticeably higher share of mestiços: 58% versus 14% for Santiago (see this table in the Historical demography section ). So it seems to me that the reason for higher African admixture in Santiago must mostly be found rather in the preceding centuries (1500’s/1600’s).
Then again this theory of differentiated reproduction rates for various segments of Cape Verde’s population is not farfetched in itself. It might also (partially) explain why the mestiço/mixed race share of Cape Verde’s total population has steadily been increasing between 1731 and 1900! Another aspect to take into consideration then also being the role of mulatto/mestiço men in the dispersion of European genes among the Cape Verdean population. For example the spread of European Y-haplogroups is not per se a reflection of the reproduction rate of European men but also their mixed-race male descendants! Especially when being privileged by social status of any kind they may have had disproportionate offspring, incl. also with unmixed “black” Cape Verdean women. Just going by anecdotal evidence many Cape Verdean men of older generations tend to be boastful of the number of children they have conceived. Polygamy is also being mentioned by several historians as a frequent aspect of Cape Verdean society. Hopefully future research will be able to shed more light on this topic.
2) As shown in Table 1 Cape Verdeans usually have European and not African paternal haplogroups. This is in line with so-called sex-biased admixture. Also commonly observed among other parts of the Atlantic Afro-Diaspora. This means that historically speaking European DNA has usually been inherited by way of male ancestors. Which is especially detectable from Y-DNA. European/Portuguese settlers in Cape Verde have been overwhelmingly male. While European/Portuguese women were very rare. So this outcome should not be really surprising.
Regarding the nature of this European geneflow I think it’s wise to refrain from “weaponizing” history without knowing all the actual details. Aside from structural forces enabling abuse there would usually also be room for individual agency. Victim-perpetrator narratives do not always apply or turn out be much more nuanced than imagined. Of course I am not in favour of any continued sugarcoating of all the horrible practices which took place during the colonial era. However at the same time I do also think that a one-sided and heavily Americanized way of framing things is not going to contribute to a balanced evaluation and complete narrative of complex histories. In particular such an approach is at risk of obscuring and distorting important localized variations across the Afro-Diaspora.
Either way it is important to keep in mind that personal family histories are bound to sometimes deviate from the assumed narrative. Ultimately it might be self-defeating to allow generalizations about European admixture to determine how you should feel about your own unique DNA makeup. Especially without at least having done any basic genealogical & historical research of your own in advance. You might then of course still encounter negative aspects. Especially when solely judging through a modern moral lens. However also often unexpected details might turn up enriching your research and making it more insightful. Things are often far more complex, inter-connected and intricate than you might assume at first.
For example it is pertinent to be aware of the fact that especially during the 1800’s there was an increase of Portuguese exiled men being sent to Cape Verde. Most of them ended up being absorbed in the local population. Given the rarity of European women naturally they would usually have local Cape Verdean partners. And again at that time the share of enslaved persons would be below 10%. For more details see:
- “Cabo Verde: formação e extinção de uma sociedade escravocrata (1460-1878)”, (António Carreira, 2000, p.411, p.415)
3) In Verdu et al. (2017) it is mentioned that many of their Santiago-based samples had either parents or grandparents who were born on different islands. In some cases even from abroad (Angola, São Tomé etc.). Furthermore most of their samples were from Praia instead of Santiago’s interior. This might be somewhat problematic. Because it is known that Cape Verde’s capital has had a great influx of migrants from other islands (aside from the interior as well). Praia’s population grew from only 20,000 inhabitants in 1960 to a staggering 170,000 in 2020 (see this graph)! This circumstance makes it all the more crucial that a “4-grandparents born on the same island” criterium is being applied. In particular when aiming to make statements about the historical population structure of each separate island. Of course populations are constantly changing and inter-island migration has been in existence for a longer time. Still the scale of modernday migration and hypermobility is clearly a new development which should be taken into account when striving for quality sampling.
In the interest of even more refined analysis for this research field I would also like to make the following suggestion. Perform dedicated sampling among older people living in the remotest part of the islands. I believe on Santiago the population from the interior is often referred to as Badiu di Fora. I know for Santo Antão people with the “thickest” accents are said to be talking “fund“. Usually stereotyped to be from the more remote ribeira’s (valleys). Given relative isolation I would assume that sampling these people will offer very precious testimony of both genetics and linguistics! A legacy which might now be under threat given the rapid modernization taking place in most islands.
4) Although certainly useful I do find it unfortunate that this study by Verdu et al. (2017) offers no detailed statistics beyond its charts. This would have provided insight into the exact admixture proportions of their Santiago study group (n=44). When Verdu et al. are stating that Cape Verdeans are “a combination of Iberian and Senegambian sources“, this is of course in line with previous research based on haplogroups (Brehm et al., 2002 and Stefflova et al., 2011). Also my own surveybased research already established in 2015 that Cape Verdeans are overwhelmingly Upper Guinean in origins. When looking only at their African DNA and based on autosomal genotyping by AncestryDNA. Also the mostly Iberian origins of Cape Verdeans could already be deduced from looking into personal DNA testing results for Cape Verdeans by both AncestryDNA and 23andme, since atleast 2013!
It is of course very pertinent that the authors point out that:
____________________
” Our genetic analysis, placing the Cape Verdean population on a trajectory distinct from that of other populations that have European and African ancestry and that are descended from the transatlantic slave trade, highlights the diversity present in populations resulting from intercontinental admixture.” (Verdu et al., p.2532, 2017)
____________________
But again this was not a real novelty given that Stefflova et al. (2011) had already established this based on haplogroup analysis. While in my own surveybased research I also came to the same conclusion in 2016 (see this blogpost). I suppose the ADMIXTURE analysis performed by Verdu et al. (2017) was intentionally focused on zooming into genetic similarity with Iberian and Mandenka/Mandinka samples. However at the same time this also makes their analysis quite basic and restricted in scope. Lacking the fine-grained detail available on both 23andme and AncestryDNA. Enabling the detection of for example additional West Asian and Jewish lineage as well as a minor degree of possibly non-Upper Guinean lineage for Cape Verdeans. See :
- 100 Cape Verdean AncestryDNA results (Fonte Felipe, 2018)
- 100 Cape Verdean 23andme results (Fonte Felipe, 2021)