Ever since I got my first DNA test results in 2010 I have been researching my Cape Verdean roots from several angels. Of course everything starts with personal genealogy. But for deeper understanding I also take into account: population genetics, historical demography and cultural retention. In 2014 I created a website exactly with this purpose in mind: CVRAIZ: Specifying The African Ethnic Origins for Cape Verdeans. In that same year I also started a separate blog called Tracing African Roots. I have used this blog for taking a broader perspective. Among other things also aiming to apply a comparative analysis to see how Cape Verde fits in the broader picture of the Afro-Diaspora.
Right from the start in 2010 I have been actively engaging with other DNA testers on online forums, Facebook and also by way of sharing profiles etc.. This is how I was able to have access to an ever growing dataset of Cape Verdean personal DNA test results. As well as from other parts of the Afro-Diaspora and mainland Africans. This has given me an invaluable opportunity to explore the regional African origins of people from across the Afro-Diaspora. And additionally also to gain greater insight into Cape Verdean genetics by way of survey-based research.1
Table 1 (click to enlarge)

***
I discovered the indispensable Slave Voyages website around the same time I received my own 23andme results in 2010. And ever since I have often relied heavily on the Trans-Atlantic Slave Trade Database as some sort of baseline. To establish historical plausibility within my ongoing research efforts on how personal DNA test results (regional admixture & African DNA matches) of Cape Verdeans and other Afro-Diasporans may already be in alignment with historical expectations.2
On this page I will merely post a brief summary of my main surveyfindings based on AncestryDNA results. I myself got tested with AncestryDNA in 2016. But these survey efforts were started in 2013 already.3 Please read the original blogposts for more detailed discussion, incl. methodology and relevant disclaimers:
- African breakdown for AncestryDNA testers across the Afro-Diaspora (Fonte Felipe, 2022)
- Fula, Wolof or Temne? Upper Guinean AncestryDNA results 2013-2018 (Fonte Felipe, 2019)
- DNA matches reported for 50 Cape Verdeans on AncestryDNA (part 1) (Fonte Felipe, 2018)
- 100 Cape Verdean AncestryDNA results (Fonte Felipe, 2018)
- Update: Afro-Diasporan AncestryDNA Survey (Fonte Felipe, 2018)
- Diaspora Comparison (Fonte Felipe, 2016)
- Cape Verdean AncestryDNA Results (Fonte Felipe, 2015)
***
1) African breakdown for AncestryDNA testers across the Afro-Diaspora (2022)
Figure 1.1 (click to enlarge)

***
Table 1.1 (click to enlarge) Based on the updated results for 50 AncestryDNA testers from across the Afro-Diaspora. The share of so-called “Senegal” in the African breakdown of Cape Verdeans has reached the 90% level. This share has been steadily increasing with each update on AncestryDNA. With “Mali” still being the most important secondary region. Even if greatly minimized (possibly through oversmoothing) regional scores from outside of the Upper Guinea area are still persistent. The individual results can be seen by way of this spreadsheet.
____________________
“In order to judge how Ancestry’s 2022 update has impacted the results of people across the Afro-Diaspora I have yet again performed a small but still comprehensive survey for various Afro-descended nationalities (n=50). And I must say the results are more in line with historical plausibility than ever before.” (Fonte Felipe, 2022)
____________________
2) Fula, Wolof or Temne? Upper Guinean AncestryDNA results 2013-2018 (2019)
Table 2.1 (click to enlarge)

***
Table 2.2 (click to enlarge)

____________________
“When I talk about an “Upper Guinean genetic component” this is strictly speaking from a macro-regional perspective. Relating to generic DNA to be found in higher frequency within the wider Upper Guinea area. And therefore not unique to any given ethnic group or country! However this approach will allow for a distinction to be made with the remaining part of West Africa (Ghana-Nigeria etc.), Central & Southeast Africa as well as North & East Africa. Such a perspective can be very valuable even when it lacks finer resolution (it is still sub-continental though!). Especially when combined with other insights.” (Fonte Felipe, 2019)
“Your “Senegal” and “Mali” amounts are likely to be traced back to numerous family lines and not a single one (unless you happen to have relatively recent West African ancestry). Just as an example: a 25% “Senegal” score for a typical Cape Verdean might be due to the genetic contributions of at least 250 different ancestors born throughout Upper Guinea! On average the DNA contribution of an ancestor living in the mid 1600’s could be a mere 0.1%. (leaving aside pedigree collapse). And in fact for Cape Verdeans and also many Latin Americans it might even be that much of their Upper Guinean ancestry traces back further even. Into the 1500’s! See also: DNA inheritance from 1 single ancestor“(Fonte Felipe, 2019)
____________________
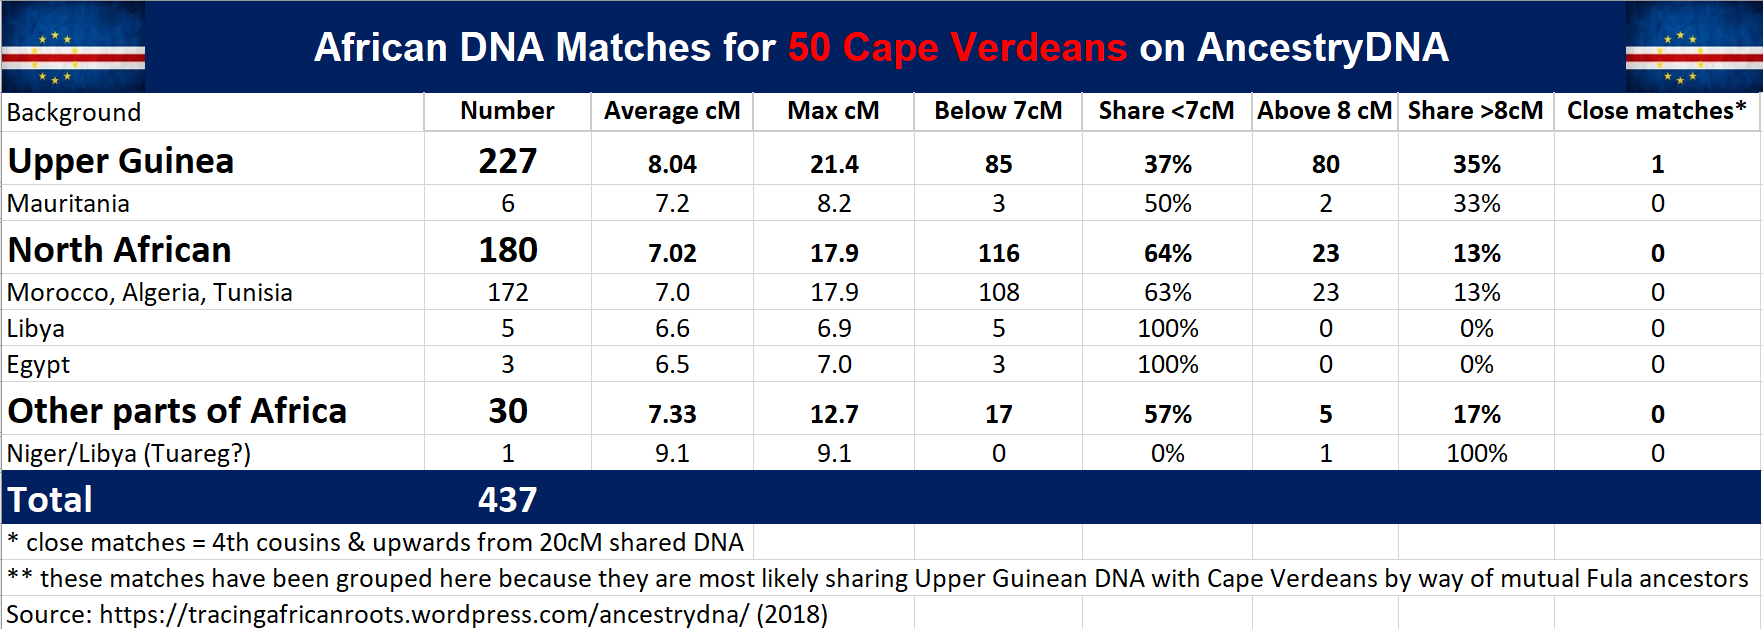
3) DNA matches reported for 50 Cape Verdeans on AncestryDNA (2018)
Table 3.1 (click to enlarge)

____________________
“By applying a more suitable categorization we can establish that the proportion of Upper Guinean related matches is 88% of all African matches (south of the Sahara). […] When seen from that perspective the African DNA matching patterns for my Cape Verdean survey group are indeed in line with their predominant historically documented Upper Guinean lineage. Which was already corroborated by admixture analysis as well! “ (Fonte Felipe, 2018)
“We should then however make allowance for the possibility that especially many of these >8cM matches may be indicative of relatively late African lineage from the 1700’s & 1800’s. Cape Verdeans will have many different ancestors originating in mainland Africa (hundreds if not thousands when tracing back to the 1500’s! see this link). Also including some relatively recent connections. Even when again I still suspect that on average Cape Verde’s mainland African connections are mostly to be traced back to the 1500’s/1600’s. ” (Fonte Felipe, 2018)
“Seven of my survey participants also shared the AncestryDNA results from one of their parents. While one survey participant (CV04) shared the results from both of his parents. Enabling me to determine if African matches were indeed inherited by way of one of the parents. In other words this allowed me to investigate their share of IBD (Identical By Descent) matches. […]
As they seem to indicate that “exotic” and unexpected African matches may often turn out to be false positives. As was also the case for the 8 survey participants for whom I could actually determine this (mostly based on a single parental phasing basis). After all I could not verify that matches from Cameroon, Ethiopia, Kenya, Tanzania, Zambia, South Africa, Sudan were inherited by way of the parents of my survey participants. Also North African matches from Libya and Egypt were not being confirmed. Making it more likely that these were just random IBC [Identical By Chance] matches.” (Fonte Felipe, 2018)
“To be sure direct ancestral connections with Central & Southern Africa as well as West Africa (beyond Upper Guinea) are not entirely impossible for Cape Verdeans. As the presence of a few captives from these areas has actually been documented for Cape Verde. Although very sporadically so and with minimal numbers (see this link for an overview). Another possibility might also occur by way of detour. Not directly related to slavery but rather via voluntary migrations. Through gene flow from either other parts of the Afro-Diaspora or from other former Portuguese colonies in Africa.” (Fonte Felipe, 2018)
____________________
Table 3.2 (click to enlarge)
***
4) 100 Cape Verdean AncestryDNA results (2018)
Figure 4.1 (click to enlarge)
***
Figure 4.2 (click to enlarge)

***
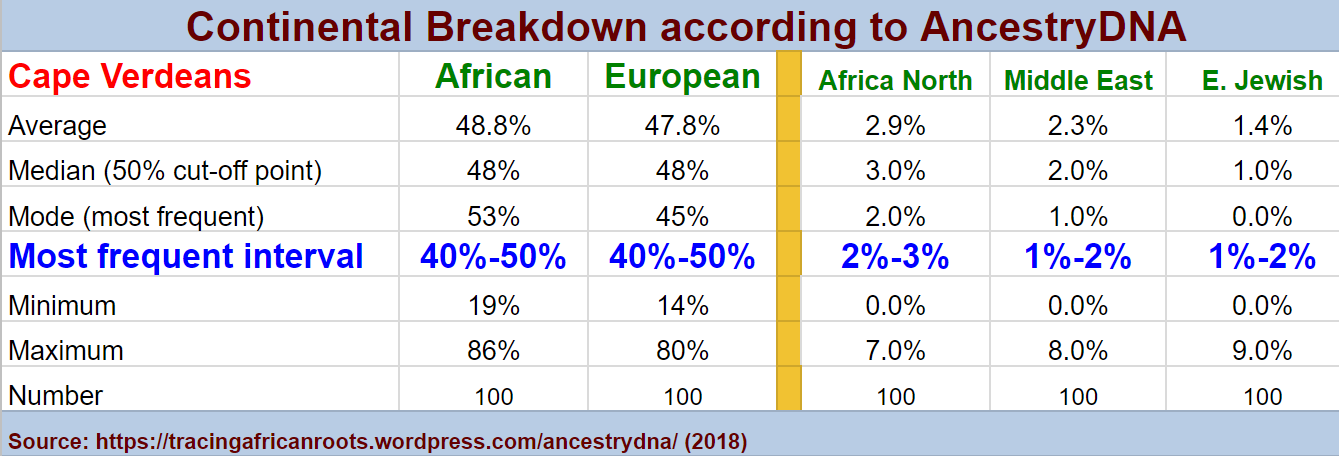
Table 4.1 (click to enlarge)

____________________
“The group averages are displaying a remarkable balance between African & European admixture. Practically 50/50 proportions. This thorough racial blending marks a key aspect of not only Cape Verdean genetics but also Cape Verdean creolized culture and Caboverdianidade. One should be careful though to exclusively equate the Creole a.k.a. Crioulo identity of all Cape Verdeans with being racially mixed per se, or at least not in balanced proportions. The all-inclusive Crioulo identity of Cape Verdeans (regardless of racial appearance or DNA results) is often misunderstood by outsiders which causes them to apply it for inappropriate and potentially divisive racial classifications.” (Fonte Felipe 2018)
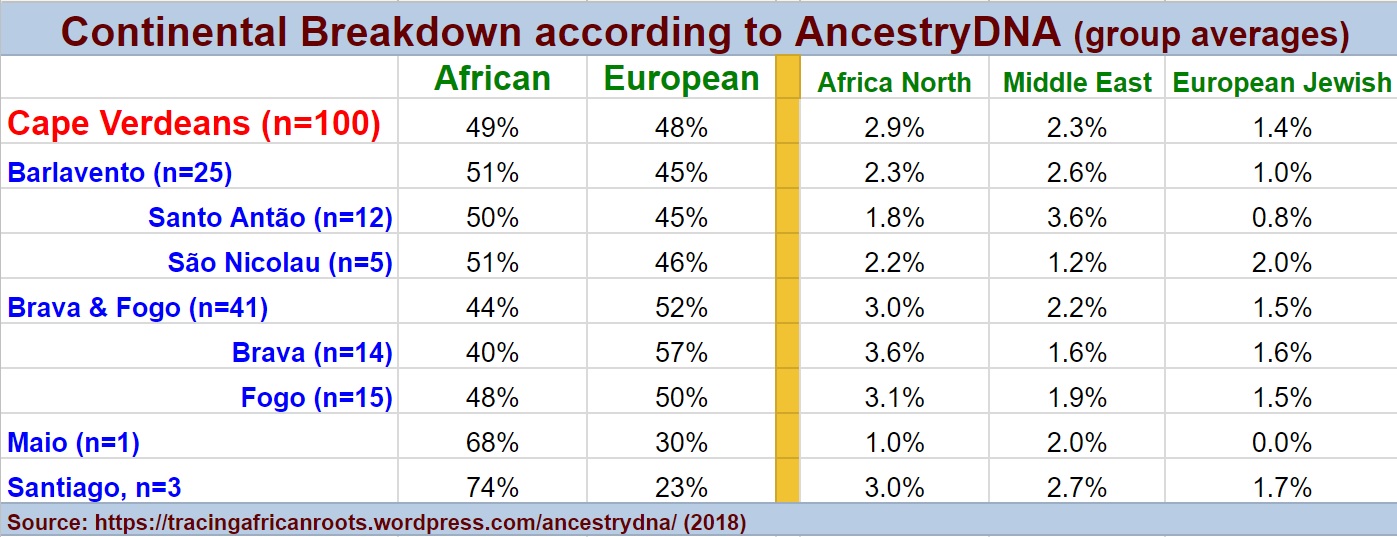
“Santiago unfortunately remains undersampled […] while other CV islands have been overrepresented. […] My own research is of course very much done on a best-effort basis. And especially in previous years (2015-2018) there were simply very few DNA testers from Santiago around. Luckily this has been changing gradually. Especially now that DNA testing is getting popular in Portugal as well there are more Santiago test results available. I have always tried to point out such sampling bias in the disclaimers of my blog posts.” (Fonte Felipe, 2023)
“Then again, the Cape Verdean Diaspora is often said to be more numerous than the actual island population. And to truly do justice to the full spectrum of Cape Verdean diversity one should take them into consideration as well. Especially because due to historical reasons and so-called chain-migration many Cape Verdean descendants abroad might have stronger links with specific islands (such as Fogo and Brava in the USA, Santiago in Portugal and Barlavento in Northwest Europe). And therefore their combined average DNA profiles might also deviate somewhat from the national average in Cape Verde itself.” (Fonte Felipe, 2024)
____________________
Table 4.2 (click to enlarge)
***
Figure 4.3 (click to enlarge)

***
Table 4.3 (click to enlarge)
***
5) Update: Afro-Diasporan AncestryDNA Survey (2018)
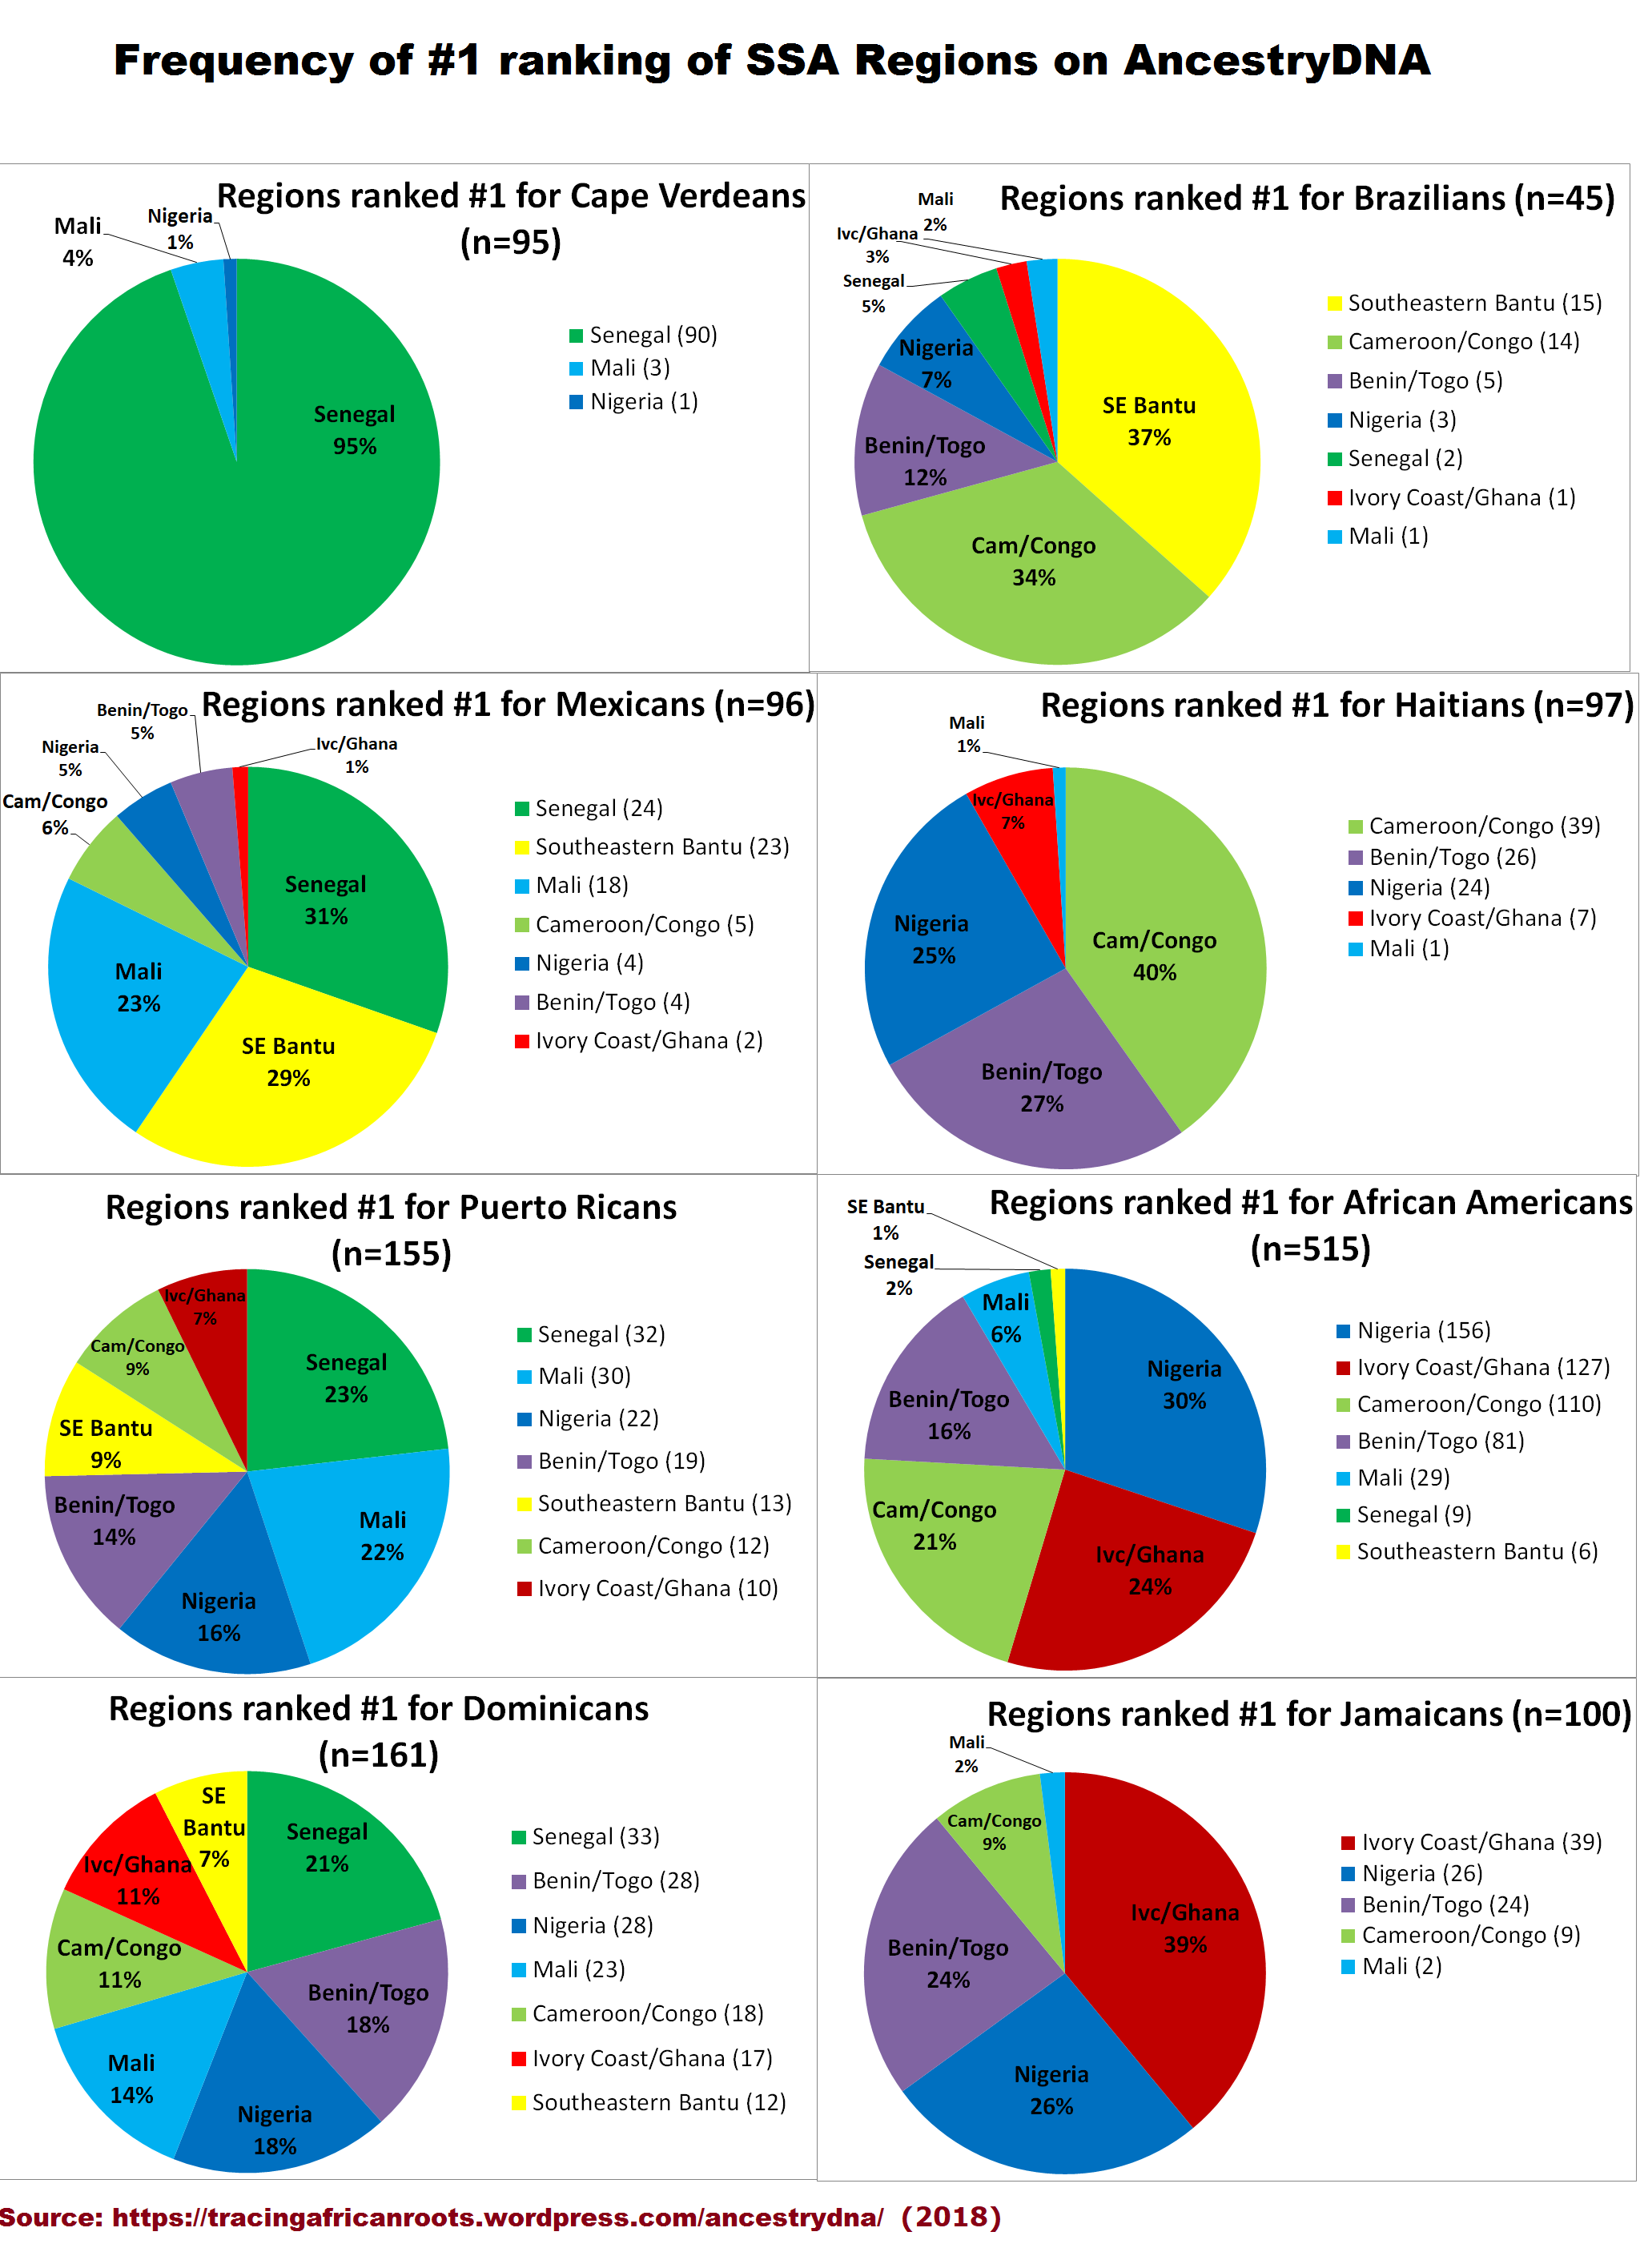
Figure 5.1 (click to enlarge)
____________________
“This frequency of regions being ranked #1 (regions with the highest amount in the African breakdown) is perhaps the best indicator of which distinct African lineages may have been preserved the most among my sample groups.” (Fonte Felipe, 2018)
“In May 2016 I published my first summary of my Afro-Diasporan survey findings based on 707 results for 7 nationalities (see this blog post). My survey has been ongoing ever since. Right now an update of AncestryDNA’s Ethnicity Estimates seems even more imminent than it was in 2016 (when it was canceled in the beta phase). So that’s why I will yet again provide a “final” overview of my survey findings
. Mainly based on 1,264 results for people from 8 nationalities. Although the total number of results and nationalities in my survey is even greater.”
“A major addition is the inclusion of 45 Brazilian results. Their predominant Central African profiles (as measured by both “Southeastern Bantu” and “Cameroon/Congo”) are quite striking when compared with my other sample groups. This outcome reinforces how the African breakdown on AncestryDNA has been reasonably in alignment with historically documented origins of the Afro-Diaspora. Unlike any other DNA testing platform I’m aware of and therefore not to be lightly dismissed despite inherent imperfections.” (Fonte Felipe, 2018)
____________________
Tablre 5.1 (click to enlarge)
***
6) Diaspora Comparison (2016)
Figure 6.1 (click to enlarge)
____________________
“The scope of my survey (707 results for 7 nationalities) compares favourable to published DNA studies, which also focus on the regional within-Africa origins of Afro-descended nationalities. In particular the inclusion of Cape Verdeans, Haitians and Jamaicans seems to be a novelty. At least when considering genomewide analysis based on autosomal genotyping and not just merely haplogroups. Otherwise see Stefflova et al., 2011 for a cross-Diaspora comparison which also features Cape Verdeans. The total number of results for these 3 nationalities especially my Haitian sample group (n=24) is admittedly rather limited. But as the results were randomly obtained they could still be reasonably indicative of the African diversity present in their genepools and its main tendencies.” (Fonte Felipe, 2016)
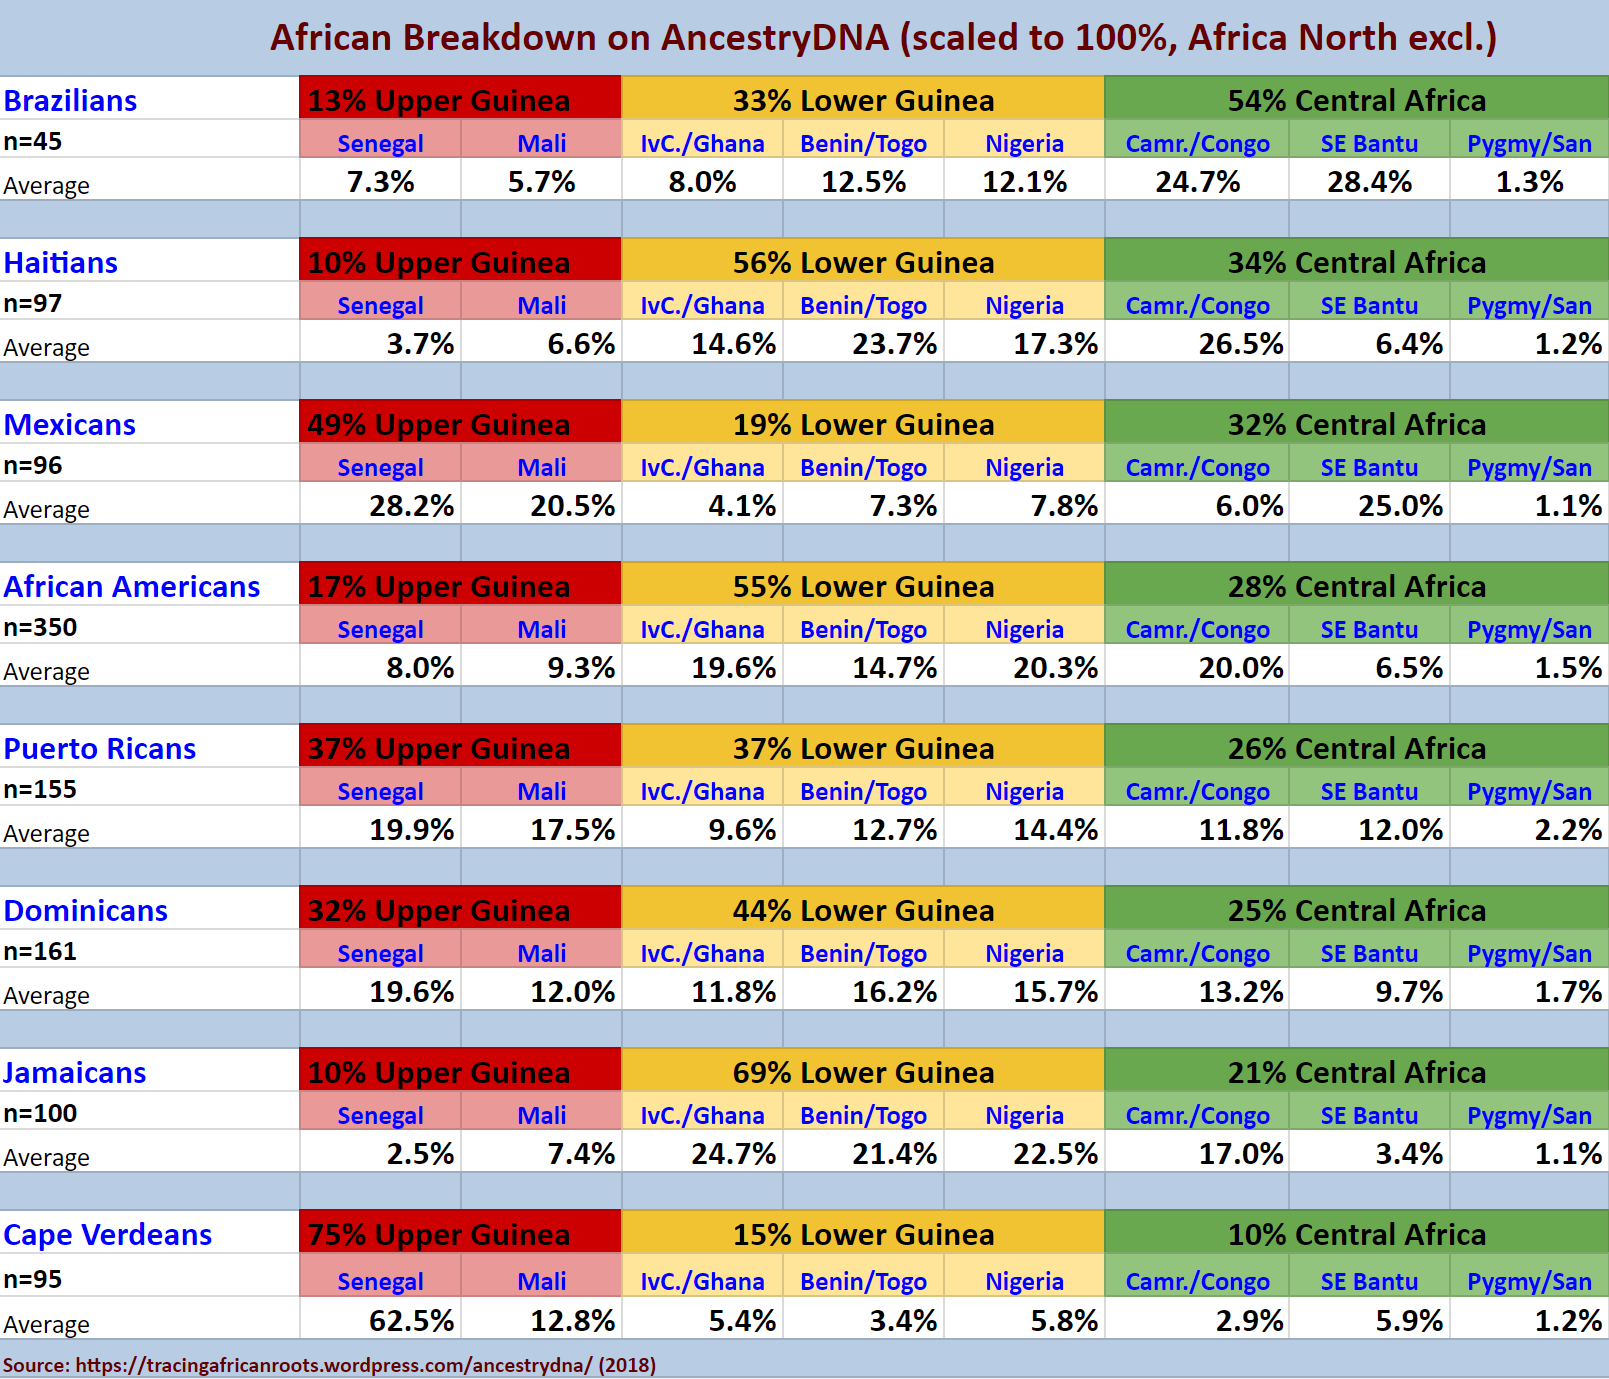
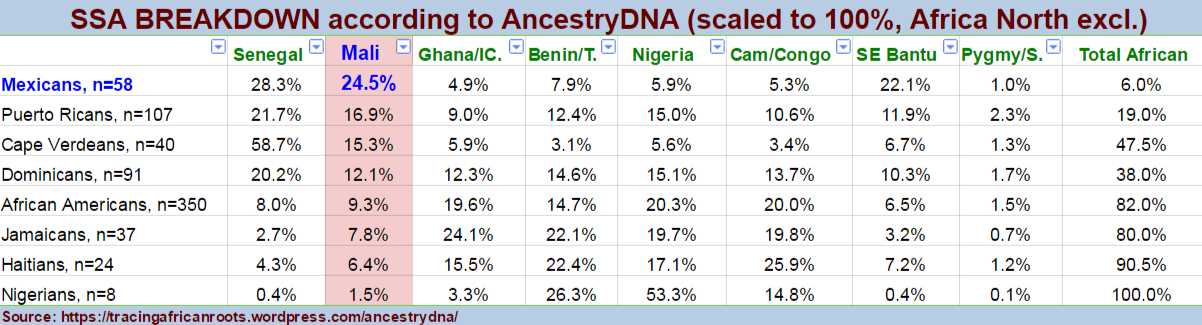
“From all the nationalities in my survey only Cape Verdeans show a predominant proportion of their African DNA coming from just one region (“Senegal”). As can be verified from their average “Senegal” scores (58.7% when “Africa North” is excluded). Also “Senegal” is almost consistently being ranked #1 in their results (36/40). Combining the average scores for “Senegal” with “Mali” this AncestryDNA analysis seems to confirm for the first time (afaik) that Cape Verdeans are overwhelmingly (~75%) of Upper Guinean origins according to autosomal genetics (see chart 2.3).” (Fonte Felipe, 2016)
“Hispanic Americans show higher degree of Upper Guinean roots than African Americans – One of the most intriguing outcomes of this AncestryDNA survey for me personally was seeing the genetic legacy from the earliest victims of the Trans Atlantic Slave Trade (1500’s/1600’s) being confirmed. Many of these persons arrived in the Hispanic Americas from the Upper Guinea region (Senegal, Gambia, Guinea Bissau/Conakry and Sierra Leone), often by way of Cape Verde (see also this page). We can verify their “founding effect” by reviewing chart 2.3. The combined average scores of “Senegal” and “Mali”, together forming the Upper Guinea area, are significantly higher for all Hispanic nationalities when compared with African Americans.” (Fonte Felipe, 2016)
____________________
Table 6.1 (click to enlarge)

____________________
“As was to be expected this first Upper Guinean region convincingly peaks for Cape Verdeans, even predominantly so (>50%). While it is almost absent for my Nigerian sample group (however Nigerian Fulani will very likely show significant amounts of “Senegal”). Cape Verdeans also showed the highest frequency of “Senegal” #1 rankings within the African breakdown (36/40, see chart 2.4). The predictive accuracy of this region therefore seems to be solid and verifiable. It should be noted that not only stricly Senegambian ancestry is being measured. Aside from Guinea Bissau/Conakry this region is also describing DNA markers found in persons from as far south as Sierra Leone (see also the “African Results” page).” (Fonte Felipe, 2016)
____________________
Table 6.2 (click to enlarge)
____________________
“The socalled “Mali” region might be the least solidly defined genetic cluster according to Ancestry’s own information. However as expected my Nigerian sample group only shows a trace amount for it (again Nigerians with Fulani origins might show more of it). Significant regional overlap to the east and south of Mali might still occur especially with Burkina Faso. But otherwise “Mali” seems a fair enough indicator of Upper Guinean ancestry, even if less convincingly so than “Senegal”. This therefore second Upper Guinean region is again showing the highest averages among Hispanics and Cape Verdeans.
Very intringuingly however it peaks among Mexicans, which might be suggestive of specific ethnic lineages from Upper Guinea being more prominent for them (and to a lesser degree also Dominicans and Puerto Ricans) than for Cape Verdeans. Given historical evidence these lineages are more likely to hail from Guinea Conakry or Sierra Leone rather than Mali itself, despite the labeling of this region. Making allowance for any inherent restrictions of the current AncestryDNA analysis it seems at least noteworthy that the proportional ratio of “Senegal” and “Mali” is nearly balanced for Mexicans (28,3% versus 24,5%) while it is clearly shifted to “Senegal” for Cape Verdeans (58,7% versus 15,3%).” (Fonte Felipe, 2016)
____________________
7) Cape Verdean AncestryDNA Results (2015)
Table 7.1 (click to enlarge)

____________________
“The second chart features an additional macro-regional breakdown into “Upper Guinea”, “Lower Guinea” and “Central Africa” which is of my own making. In order to get a strictly “SSA” comparison i have excluded the region “North Africa” and corrected the other averages accordingly. Making this distinction is admittedly arbitrary and can only produce a rough proxy, given the limitations of AncestryDNA. Still I find it useful because you get to see some patterns more clearly and it conforms with what’s common in slave trade literature. For ethnolinguistical and historical maps from these 3 main regions of provenance see: Upper Guinea, Lower Guinea, Central Africa.” (Fonte Felipe, 2015).
“Undoubtedly with more Cape Verdean testresults available you might also see additional or different patterns. Still i think the screenshots i will post in the last section of this page might be representative to a large degree for how many other people of Cape Verdean descent would score hypothetically speaking” (Fonte Felipe, 2015).
“Combining the average scores for “Senegal” with “Mali” this AncestryDNA analysis seems to confirm for the first time (afaik) that Cape Verdeans are overwhelmingly (~75%) of Upper Guinean origins according to autosomal genetics, see also second chart. Previous haplogroup studies have also come to the same conclusion, however they were restricted in the sense that they didn’t measure the complete, genomewide ancestry of Cape Verdeans but only focused on maternal lineages.” (Fonte Felipe, 2015).
“In order to improve the understanding of the Upper Guinean origins of Cape Verdeans it would be very helpful though if somehow a more specified genetic distinction could be made between the coastal ethnic groups of Casamance and Guinea Bissau (Papel, Bijagos, Beafada, Balanta, Jola etc.) on the one hand and the strictly Senegambian (Wolof, Sereer, Mandinga etc.) on the other hand. This finerscaled resolution will probably not be available in the foreseeable future eventhough some DNA studies have already made some fruitful attempts (see Jallow et al.,2009).” (Fonte Felipe, 2015).
“Surprisingly also minor contributions are showing up for both Lower Guinea and Central Africa. This is unexpected when going by Cape Verde’s geographical location and what historical sources have documented about slave trade patterns between Cape Verde and the mainland (see “Cabo Verde, Raizes na Africa“). These sources clearly describe the area in between Senegal and Sierra Leone as practically the only provenance zone for African captives brought to Cape Verde safe for some individuals who came on atypical slave voyages from further away.” (Fonte Felipe, 2015).
“Also given other limitations of the AncestryDNA analysis it might therefore perhaps be premature to speculate on what these findings might really represent or how robust they might be. They might merely be reflecting generic West African DNA markers which cannot be distinguished yet with greater reliability. Or it could be a misreading of ethnic origins from especially Sierra Leone. Probably only an update of AncestryDNA reference populations might bring more clarity or else comparing with the AncestryDNA results of actual Upper Guineans (to verify if they also show other regions besides “Senegal” and “Mali”).” (Fonte Felipe, 2015).
____________________
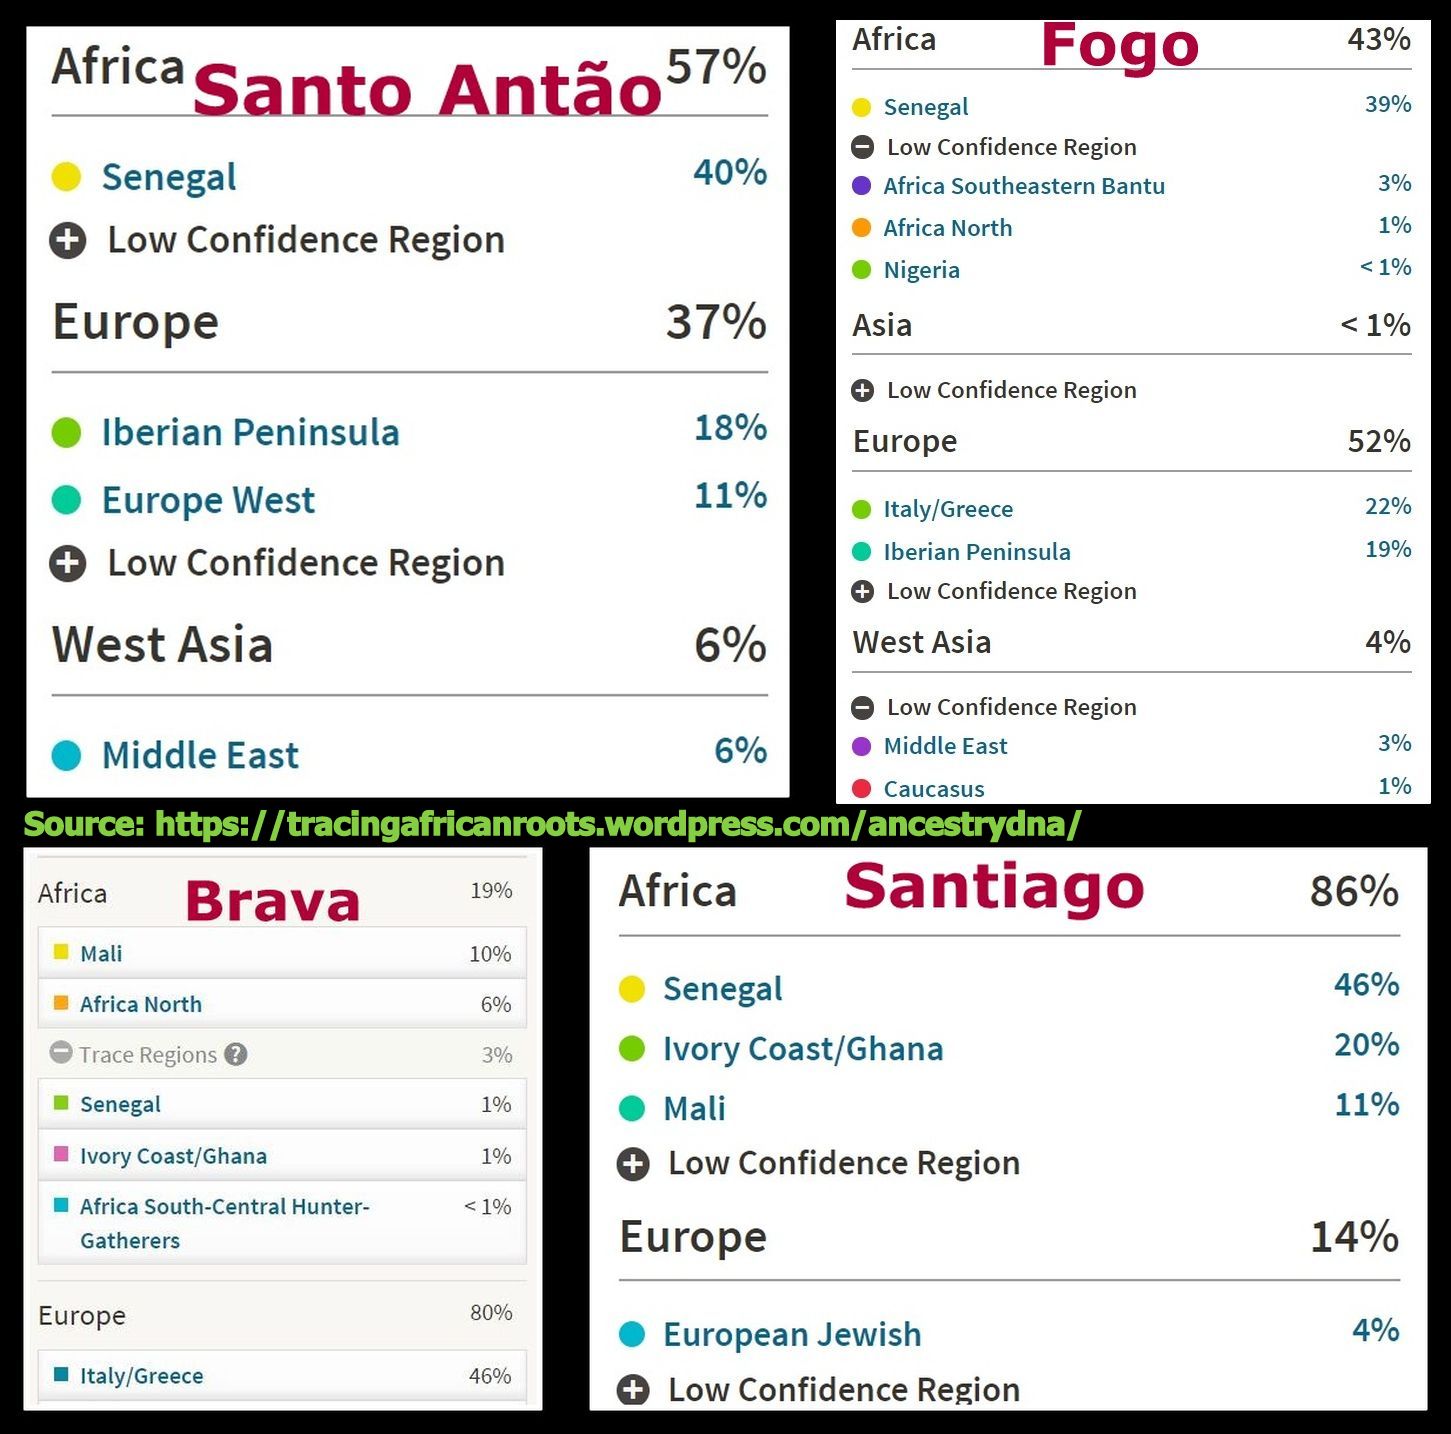
Table 7.2 (click to enlarge)

____________________
“This third chart is showing an inter-island comparison for those samples who mentioned both parents being from the same island. It’s obviously very limited because of the minimal samplesize. Also some of the results were from close relatives (siblings, parents/child). Still perhaps already 1 or 2 visible trends might also be obtained with larger samplegroups.“ (Fonte Felipe, 2015).
“Cape Verdeans can be expected to be a very closely interrelated people across the islands because of their shared history. But it might still be useful to study any of the seemingly small differences occuring between the various islands. As it could tell us more about which ethnic groups might have been involved in the settlement of each island to a possibly greater degree than elsewhere. Genetic differentation between the northern islands (“Barlavento”) and the southern ones (“Sotavento”) has already been reported in DNA studies (see “DNA Evidence“). And it has been correlated with “a common origin in Santiago, followed by differentiation through genetic drift and subsequent input of independent external migrations” (Beleza et al., 2012).” (Fonte Felipe, 2015).
“So that leaves us to search for any explanations which might validate this AncestryDNA outcome as representing genuine origins from most likely Angola and/or Mozambique. If found to be truly so (even if only partially) I suppose this could be the first time a noticeable Central African contribution to the Cape Verdean genepool has been detected in a systematic manner. My samplegroup being admittedly limited in number, yet also randomly picked and with most of the islands represented.” (Fonte Felipe, 2015).
“Again much caution should be applied when interpreting this outcome but it might be an ancestral hint that somehow people of Congolese or (northern) Angolan origin were present in the northern islands to a relatively greater degree than elsewhere and left a minor yet detectable genetical legacy diffused among the general population. However keeping all options open it could also be something specific for only these 6 samples and reflecting unique lines in their family trees. Possibly even involving intermarriage with (mixed-race or black) Brazilians who are also likely to be carrying these Central African DNA markers.” (Fonte Felipe, 2015).
____________________
Santiago
“This guy made an excellent Youtube video about his results, which can be seen via this link. Or also below. His original “Senegal” score of 50% is the highest among my samplegroup but also calculated as a ratio to total African ancestry it’s above average (50/75=66%). (see this screenshot of his results).
He mentions in the video he could have at least 1 possible Fula ancestor from somewhere in the 1800’s. But that might be just one out of several i guess. It might explain the rather high “Middle East” although his “North African” seems about average. Very interesting to compare his overall breakdown with someone of Fula descent (see African results). On first sight the results look quite similar. But given their long history of intensive creolization and intermixing of various people from across Upper Guinea it’s unlikely Cape Verdeans would be of exclusive Fula descent. However a partial Fula contribution, significant even, is not be ruled out either of course. It’s noteworthy therefore that not only the predominant “Senegal”+”Mali” combination is mirrored (around 60% for both) but also to lesser degree “North Africa” is showing up (2% versus 16%) and even the “Middle East” (6% versus 17%). “ (Fonte Felipe, 2015)
____________________
***
___________________________________________________________________________
Notes
1) Due to source snobbery personal DNA testing results are not always fully appreciated for their informational value. I myself have never taken this overly dismissive stance. Preferring to judge each case on its own merits. From my observations especially 23andme and AncestryDNA are well-equipped to deliver results in line with the known or historically plausible backgrounds of Cape Verdeans as well as other Atlantic Afro-descendants. Of course correct interpretation and knowing how to really “read the data” remains a crucial requirement. For a more detailed discussion on the inherent restrictions of personal DNA test results see these pages:
- 23andme surveys (2011-ongoing)
- Ancestry surveys (regional admixture: 2013-2018)
- Ancestry surveys (DNA matches: 2017-ongoing)
2) The earliest summary of my Cape Verdean survey findings was put online in 2015. Which was (as far as I know) the first ever demonstration that Cape Verdeans are overwhelmingly Upper Guinean in origins. When looking only at their African DNA and based on autosomal genotyping. Previous haplogroup studies (see this link) did also come to the same conclusion. However they were restricted in the sense that they didn’t measure the complete, genomewide ancestry of Cape Verdeans but only focused on maternal lineages.
This finding was quite distinctive. In particular when contrasted/compared with other survey groups from across the Afro-Diaspora. Which I blogged about for the first time in 2016. This outcome has been replicated in all my subsequent surveys. Which also indicate a so-called Upper Guinean Founding Effect for many Hispanic Americans. Similar to Cape Verdeans also mostly to be traced back to the 1500’s. This is also something I established by way of surveybased research already in 2015.
Actually my very first survey efforts date back even earlier to 2011. Based on the pioneering African Ancestry Project by Razib Khan. I shared these findings also on 23andme’s online community at that time. They can still be seen in this online spreadsheet. Already then I was able to make good use of Cape Verdean DNA results as some sort of control group within a broader dataset of Afro-descendants. Albeit that of course the sample size was very minimal, given that personal DNA testing had not yet become popular.
This early research opened my eyes to the fact that Cape Verdeans form a special part of the Afro-Diaspora, given that their African roots are overwhelmingly from Upper Guinea. And this should also be reflected in their DNA results (if they are any good ). In this case a tellingly pronounced genetic affiliation with “Mandenka” showed up already in 2011 (see this overview)!
Unlike commonly assumed you do not need to sample entire populations to obtain informational value with wider implications. Naturally greater sample size does (usually) help matters. However I find it reassuring that in many aspects peer reviewed studies based on larger sample size have vindicated my own earlier findings. While due to free format on my blog I am often able to provide greater detail and more appropriate context.
In my latest survey efforts (based on both 23andme and Ancestry results) my Cape Verdean survey group has taken a more robust sample size of n=100. And in the near future I aim to expand especially the coverage of DNA results from Santiago, Maio, Boavista and Sal. Continued corroboration of my own research is not only to be seen in the DNA studies reviewed on this website. But also a few years ago my survey findings were replicated by the huge study performed by 23andme’s research team:
- Genetic Consequences of the Transatlantic Slave Trade in the Americas (Micheletti et al., 2020) (go to section 2 for Cape Verde related discussion)
To specify the overlap with my own research more clearly. See below for an overview of aspects about Cape Verdean genetics which I already established several years ago.
1) Cape Verdeans being mainly an Upper Guinean/Iberian mix: 2018, 2021
2) Interisland differentiation/substructure: 2015, 2018, 2021
3) Minor non-Upper Guinean lineage: 2015, 2018a, 2018b, 2021
4) Comparison with other parts of Afro-Diaspora: 2016, 2018a, 2018b, 2021
5) Recent ancestry (1800’s) from Portugal & Upper Guinea: 2018a, 2018b, 2022
Furthermore my own research has also gone beyond what has been published sofar by peer reviewed studies. In particular for these aspects:
1) IBD matching patterns (Ancestry, 23andme): 2018, 2022
2) Analysis of North African/Sephardi Jewish lineage: 2015, 2018a, 2018b
3) Analysis of South Asian and Amerindian lineage: 2018a, 2018b, 2021
4) Indications of Northwest European lineage: 2013, 2018, 2021
3) In 2013 AncestryDNA updated their Ethnicity Estimates to include a very detailed breakdown of West African ancestry (see this article). A pioneering initiative when compared with the rather basic regional within-Africa resolution being provided by other DNA testing companies, at that time. Starting also in 2013 I have been collecting AncestryDNA results in a spreadsheet in order to conduct a survey of the African origins being reported by AncestryDNA for Cape Verdeans as well as other Afro-descended nationalities. I ended this survey when Ancestry performed a new update in 2018. My final surveybased dataset contains at least 1,377 results for 34 nationalities. See link below for more details incl. methodology etc.
***(click to enlarge)

***